The Silent Failure
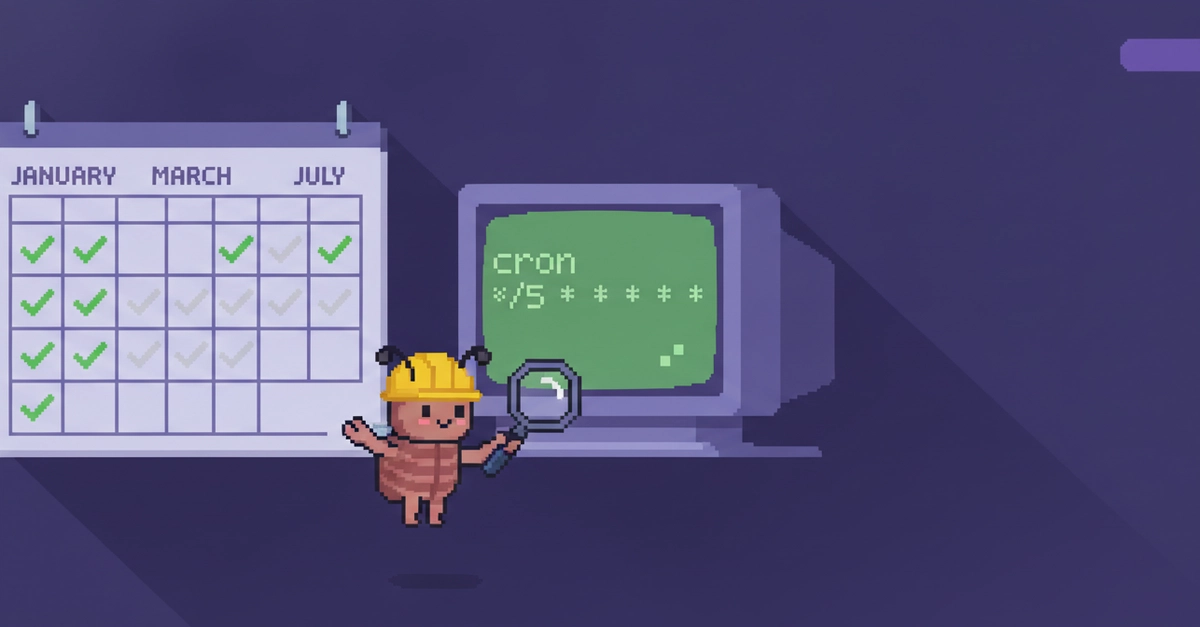
A developer, Mr. Viduus, recently revisited a repository for a project called TextStack. He discovered a critical issue with his uptime monitoring system. The monitor was configured to run checks every five minutes. However, during the month of July, it only executed approximately 15 times per day. This meant that for large portions of each day, the system's uptime was not being verified, leaving potential issues completely undetected.
This discovery is part of a series of bug-smashing stories Mr. Viduus has been documenting. Previous issues included a 390% CPU spike that went unnoticed for an hour, a state machine stuck in a perpetual 'preparing' state with no exit condition, and a backup process that leaked 156 GB of data, filling disks and causing its own failure. This particular bug, the silent failure of the uptime monitor, highlights a different kind of problem: the absence of alerts when nothing *seems* to be wrong. The monitor was supposed to catch downtime, but instead, it was quietly failing to run at all, an even subtler form of malfunction.
The implication is stark: if your monitoring system isn't actually monitoring, you're operating under a dangerous false sense of security. Hours, or even days, of downtime could pass without any notification. This scenario is akin to a fire alarm that is installed but never tested; it might look like it's working, but it won't do its job when needed. The problem wasn't that the system was down, but that the system *designed to detect* the system being down was itself not functioning correctly.
Diagnosing the Discrepancy
The root cause of the monitor's failure to execute as scheduled was not immediately obvious. A simple misconfiguration or a crash would typically be easier to diagnose. The subtle nature of this bug meant that the monitoring system itself was not reporting any errors. It was simply not performing its intended function. This lack of overt failure makes such bugs particularly insidious, as they don't trigger the usual alerts or debugging workflows.
The developer's process for identifying this issue likely involved a retrospective analysis of system logs or performance metrics. By comparing the expected number of checks (288 per day, based on a 5-minute interval) with the actual number of executions (around 15), a significant discrepancy was revealed. The challenge then became understanding *why* the monitor was not being triggered. Was it a cron job failure? A service outage? A configuration drift?
Without specific details on the exact monitoring tool used or the underlying infrastructure, pinpointing the exact failure point remains speculative. However, common causes for such issues include:
- Cron Job Failures: If the monitor was scheduled via a cron job, the job itself might have been disabled, misconfigured, or failing silently due to permission issues or environmental changes.
- Service Crashes: The monitoring service might have crashed and failed to restart automatically. If there was no separate mechanism to monitor the monitor itself, this would go unnoticed.
- Configuration Errors: A subtle change in configuration could have altered the execution schedule or disabled the checks without an explicit error message.
- Resource Constraints: In rare cases, severe resource limitations on the server hosting the monitor could prevent it from running, though this usually manifests with other system-wide issues.
The core problem is the reliance on a single point of failure for monitoring. If that point fails, the entire monitoring capability is lost. This situation underscores the importance of not just monitoring your application, but also monitoring your monitoring systems.
Broader Implications and Prevention
The incident with Mr. Viduus's uptime monitor serves as a critical reminder for developers and operations teams. Relying solely on a single monitoring tool or configuration without a fallback or a meta-monitoring layer is a significant risk. When a system designed to ensure reliability fails silently, it creates a void where errors can propagate undetected, potentially leading to extended outages and significant business impact.
To prevent such silent failures, several strategies can be employed:
- Monitor Your Monitors: Implement a secondary layer of checks to ensure your primary monitoring systems are active and functioning correctly. This could involve a simple heartbeat check on the monitoring service itself, or an external service pinging your internal monitor.
- Redundant Monitoring: Use multiple monitoring tools or services. If one fails, others can still provide alerts. Consider a mix of internal and external monitoring solutions.
- Alert on Silence: Configure alerts not just for when a system is down, but also for when expected check-ins or data points are *missing*. This is particularly relevant for systems that should be generating regular output or metrics.
- Regular Audits and Testing: Periodically review monitoring configurations and perform simulated failure tests. This helps catch misconfigurations or potential issues before they lead to real outages.
- Observability Beyond Uptime: While uptime is crucial, a comprehensive observability strategy includes metrics, logs, and traces. A failure to generate logs or metrics, even if the service is technically 'up', can indicate deeper problems.
The incident is a valuable lesson: silence in monitoring is not always golden. It can be a sign of a deeper, more dangerous problem. Developers must actively ensure their safety nets are not only in place but are also actively working.