The Challenge: Predicting Instability, Not Price
Predicting the exact price of a stock is a notoriously difficult, and often unhelpful, endeavor. The real value lies in anticipating when an asset is poised for abnormal instability. This was the core problem tackled by a novel project aiming to create a 'market sensor' that flags potential periods of extreme volatility. Unlike traditional forecasting models that aim to predict a single future price point, this approach focuses on estimating the entire distribution of potential returns for any given asset across various time horizons. The goal is to identify moments where the actual market behavior deviates significantly from the model's predicted plausible range, signaling an anomaly.
The central challenge is shifting the focus from point-estimate price prediction to understanding the probability distribution of future returns. This requires a model capable of handling complex temporal dependencies and identifying subtle shifts that might precede significant market movements. Traditional time-series models often struggle with this granular level of prediction, especially when dealing with multiple correlated assets and external factors that influence volatility.
Architecture: Temporal Fusion Transformer Meets Quantile Regression
The chosen architecture, a Temporal Fusion Transformer (TFT), is well-suited for this task due to its ability to integrate diverse data sources and provide interpretable insights. TFTs are designed to handle complex temporal patterns and are particularly effective at variable selection, a crucial feature for understanding market dynamics. This project couples the power of TFT with quantile regression to achieve its predictive goals.
TFTs offer several advantages for this specific problem:
- Variable Selection Networks: These components within the TFT learn to identify which input variables are most relevant at any given time. This provides a degree of interpretability, allowing the model to highlight the factors driving its predictions without sacrificing predictive power. For instance, the model can learn that certain macroeconomic indicators become more important during periods of heightened geopolitical tension, while others might dominate during stable market conditions.
- Static Covariate Encoders: These handle features that do not change over time, such as an asset's sector or industry classification. This allows the model to incorporate fundamental characteristics of the assets being analyzed.
- Temporal Processing: The architecture effectively processes time-varying inputs, including historical price data, trading volumes, and external economic indicators, capturing the sequential nature of financial markets.
- Interpretable Multi-Head Attention: This mechanism allows the model to focus on relevant past time steps and learn temporal relationships, offering insights into how past events influence future expectations.
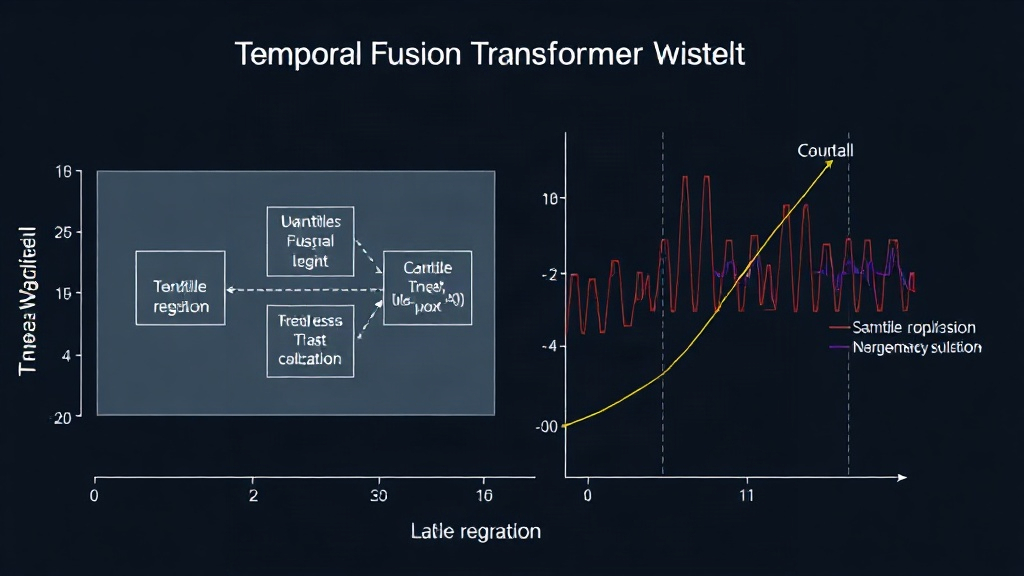
By combining TFT with quantile regression, the system doesn't just predict a single expected return. Instead, it estimates a range of likely outcomes, defined by specific quantiles (e.g., the 10th, 50th, and 90th percentiles). This allows for a more nuanced understanding of risk. An anomaly is flagged when the observed market return falls outside these predicted quantiles, indicating a deviation from the expected distribution of outcomes.
Implementation and Data Considerations
The successful implementation of this 'market sensor' relies on careful selection and preprocessing of input data. This typically includes:
- Historical Price and Volume Data: Daily or intraday price movements and trading volumes are fundamental inputs.
- Technical Indicators: Moving averages, RSI, MACD, and Bollinger Bands can provide additional signals about market momentum and overbought/oversold conditions.
- Macroeconomic Data: Interest rates, inflation figures, employment statistics, and GDP growth are crucial for understanding broader economic influences on volatility.
- News Sentiment Analysis: Processing news headlines and articles to gauge market sentiment can capture reactions to events that might not yet be reflected in price data.
- Alternative Data: Satellite imagery of shipping ports, credit card transaction data, or social media trends can offer unique, forward-looking insights.
The data needs to be aligned temporally and handled appropriately to account for different frequencies (e.g., daily stock prices versus quarterly economic reports). Feature engineering might involve creating lagged variables, rolling statistics, and interaction terms to help the model capture complex relationships.
The Anomaly Detection Mechanism
The core of the 'market sensor' lies in its anomaly detection capability. Once the TFT model generates quantile predictions for future returns, the system compares these predictions to the actual realized returns. A deviation is considered anomalous if the actual return falls beyond a predefined set of quantiles. For example, if the model predicts the 90th percentile return is X, and the actual return significantly exceeds X, this could signal an unexpected upward surge in volatility or price movement.
Conversely, if the actual return falls below the predicted 10th percentile, it might indicate an unexpected sharp decline. The sensitivity of the anomaly detection can be tuned by adjusting the quantile thresholds. A wider range of quantiles (e.g., 5th to 95th) would require a more extreme deviation to be flagged, making the sensor less sensitive but potentially more robust to noise. A narrower range (e.g., 25th to 75th) would flag more frequent deviations, acting as a more sensitive indicator.
Implications and Future Directions
This approach offers a significant departure from traditional market prediction methods. By focusing on volatility prediction, it provides a more actionable signal for traders, risk managers, and portfolio strategists. Early detection of abnormal instability can inform decisions about hedging strategies, asset allocation adjustments, or even the timing of market entries and exits.
The use of TFT with variable selection networks also offers a path toward greater transparency in algorithmic trading. Understanding which factors are driving the predicted instability is crucial for building trust and refining the model. This moves beyond the 'black box' nature of some complex machine learning models.
What remains an open question is the optimal method for integrating these anomaly signals into real-world trading strategies. While the sensor can flag potential instability, translating that signal into profitable trades requires further research into optimal execution algorithms and risk management protocols. Furthermore, the model's performance will likely depend heavily on the quality and breadth of the input data, necessitating continuous monitoring and adaptation to evolving market conditions.