Understanding Overtraining Syndrome (OTS)
Many athletes and fitness enthusiasts experience a sudden, sharp decline in performance and well-being after periods of intense training. This phenomenon, known as Overtraining Syndrome (OTS), can manifest as persistent fatigue, elevated resting heart rate, decreased motivation, and impaired recovery. It's a critical state where the body's ability to adapt to training stress is overwhelmed, leading to a net negative effect on physical and mental health.
Traditionally, diagnosing OTS relies on subjective reporting and broad physiological markers. However, a more precise and proactive approach involves analyzing subtle physiological signals that reflect the body's autonomic nervous system (ANS) status. Heart Rate Variability (HRV), the measure of the time variation between successive heartbeats, has emerged as a gold standard for this purpose. A well-functioning ANS exhibits high variability, indicating adaptability. Conversely, a decrease in HRV often signals accumulated stress and reduced recovery capacity.
Heart Rate Variability (HRV) as a Recovery Metric
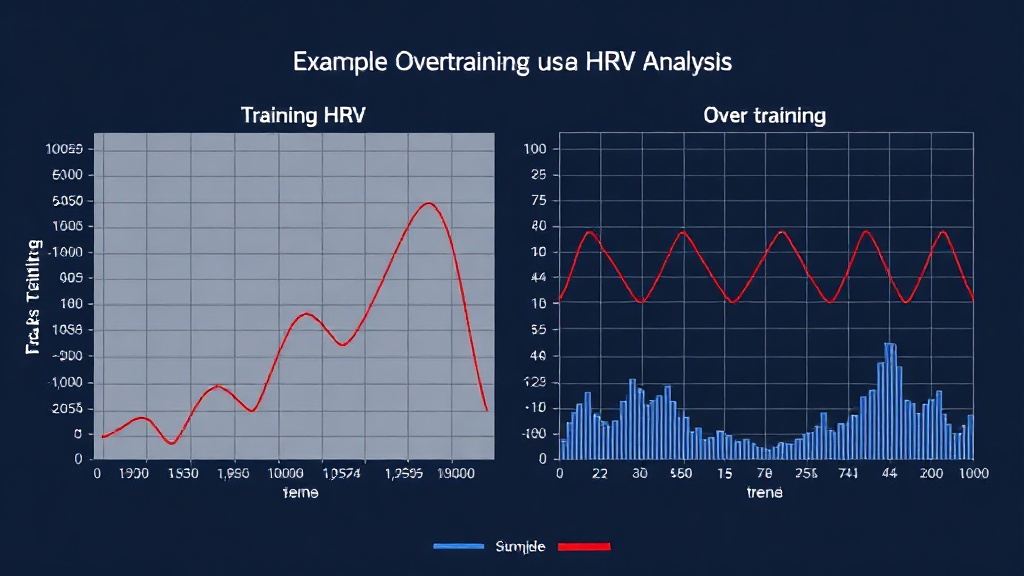
HRV quantifies the interplay between the sympathetic (fight-or-flight) and parasympathetic (rest-and-digest) branches of the ANS. When the body is well-rested and adapting positively to training, the parasympathetic system generally dominates, leading to higher HRV. During periods of high training stress, inadequate recovery, or the onset of OTS, sympathetic dominance increases, suppressing HRV. This makes HRV a sensitive indicator of an individual's readiness to perform and their recovery status.
Key HRV metrics commonly used include:
- SDNN (Standard Deviation of NN intervals): Represents the total variability in heart rate over a specified period, reflecting both sympathetic and parasympathetic influences.
- RMSSD (Root Mean Square of Successive Differences): Primarily reflects parasympathetic activity and is less influenced by long-term trends, making it particularly sensitive to short-term recovery and stress.
Building a Data Pipeline with Python and Oura Cloud API
To effectively monitor HRV, a consistent and automated data collection process is essential. This guide outlines a Python-based approach to fetch data from the Oura Cloud API, a popular platform for wearable health tracking. The Oura Ring collects extensive physiological data, including R-R intervals necessary for HRV calculation.
The process involves several key steps:
- API Authentication: Securely obtain API credentials from the Oura Cloud developer portal to access your data.
- Data Fetching: Write Python scripts using libraries like
requeststo query the Oura API for daily summary data, which includes R-R intervals or derived HRV metrics. It's crucial to specify the date range for data retrieval. - Data Preprocessing: Clean and format the retrieved data. This may involve handling missing values, converting timestamps, and ensuring data consistency. For raw R-R intervals, further processing is needed to calculate standard HRV metrics.
- HRV Metric Calculation: Utilize libraries such as
hrv-analysisor implement custom functions to compute SDNN, RMSSD, and other relevant HRV parameters from the R-R interval data.
Anomaly Detection with Isolation Forests
Once HRV metrics are collected and processed, the challenge becomes identifying anomalous patterns that indicate overtraining. Machine learning models, particularly unsupervised anomaly detection algorithms, are well-suited for this task. The Isolation Forest algorithm is an effective choice due to its efficiency and ability to detect outliers without requiring labeled data.
The Isolation Forest works by randomly partitioning the data. Anomalies, being few and different, are typically isolated in fewer partitions than normal observations. The algorithm builds an ensemble of decision trees. For each data point, it calculates an anomaly score based on the average path length across all trees. A lower path length indicates a higher likelihood of being an anomaly. In the context of HRV, a sudden, significant drop in HRV metrics (or an increase in their standard deviation, depending on the specific metric and interpretation) would likely result in a high anomaly score, signaling a potential overtraining state.
Implementing the Isolation Forest in Python involves:
- Feature Engineering: Selecting the most relevant HRV metrics (e.g., daily average RMSSD, standard deviation of SDNN) as features for the model.
- Model Training: Instantiating and training an
IsolationForestmodel from thescikit-learnlibrary on historical HRV data. Thecontaminationparameter, which estimates the proportion of anomalies in the dataset, needs careful consideration. - Anomaly Scoring: Using the trained model to predict anomaly scores for new, incoming HRV data.
- Thresholding: Defining a threshold for the anomaly score. Scores exceeding this threshold trigger an alert for potential overtraining.
This approach allows for proactive intervention, enabling users to adjust training load, prioritize recovery, or seek professional advice before OTS fully sets in.
Actionable Insights and Future Directions
The successful implementation of this HRV analysis pipeline empowers individuals to move beyond reactive training adjustments. By integrating this system, users gain a quantitative understanding of their recovery status, allowing for personalized training periodization and informed decisions about rest days or load management. This proactive approach can prevent performance plateaus and the detrimental effects of chronic overtraining.
The broader implications extend to various domains. For athletes and coaches, it offers a data-driven tool to optimize training plans. For biohackers and wellness enthusiasts, it provides deeper insights into personal physiology. Developers and data scientists can leverage this methodology as a template for analyzing other time-series physiological data from wearables.
Future work could involve integrating additional data sources, such as sleep quality, perceived exertion, and workout intensity, to build more robust predictive models. Exploring different anomaly detection algorithms or even supervised learning approaches with historically validated overtraining instances could further refine the accuracy and specificity of these predictions. The ultimate goal is to create a personalized, intelligent system that safeguards performance and promotes long-term health.