
Mimo 2.6: Live Post-Training Dashboard Unveiled
Xiaomi's Mimo platform has seen a significant update with the release of Mimo 2.6, introducing a live post-training dashboard. This new feature aims to provide users with immediate, actionable insights into their machine learning model performance immediately after the training process concludes. Historically, evaluating model performance involved manual data extraction, custom scripting, or waiting for batch reporting, a process that could introduce delays and friction into the iterative development cycle. The Mimo 2.6 dashboard promises to bypass these bottlenecks, offering a consolidated view of key metrics in real-time.
The core value proposition of this dashboard lies in its immediacy. Instead of sifting through logs or waiting for scheduled reports, developers and data scientists can now access a dedicated interface that visualizes critical performance indicators as soon as training jobs complete. This rapid feedback loop is crucial for agile model development, allowing teams to quickly identify successful training runs, detect potential issues, and make informed decisions about next steps, whether that involves further hyperparameter tuning, data augmentation, or deploying the model.
Key Features and Functionality
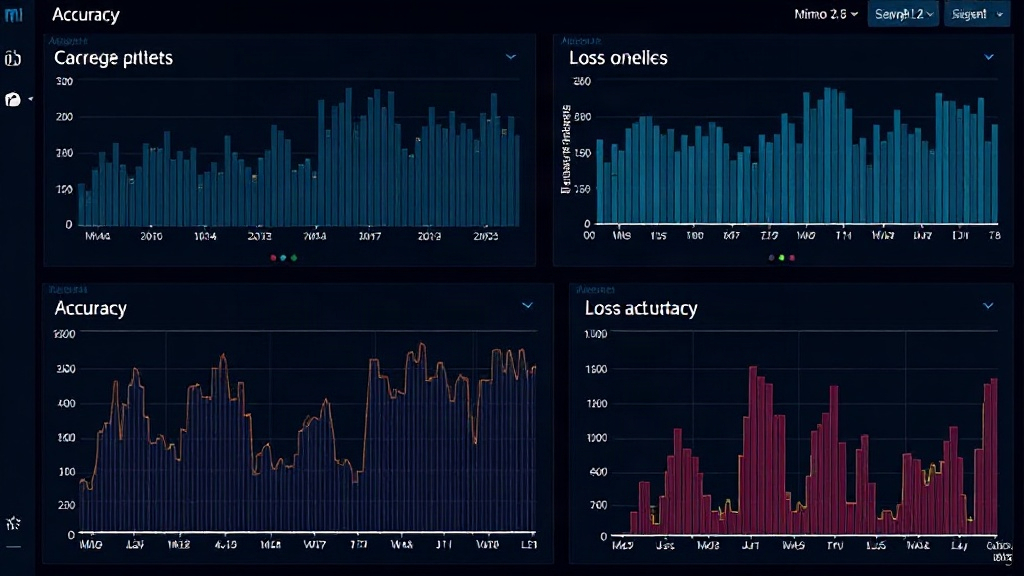
The Mimo 2.6 dashboard is designed to offer a comprehensive overview without overwhelming the user. It focuses on presenting the most pertinent information required for an initial assessment of a model's training outcome. Users can expect to find visualizations for metrics such as accuracy, precision, recall, F1-score, and loss curves. The dashboard also provides details on training duration, resource utilization (CPU, GPU, memory), and potentially early stopping criteria if applicable. This allows for a holistic understanding of not only how well the model performed but also the efficiency of the training process itself.
One of the standout aspects is the interactive nature of the visualizations. Users can typically zoom into specific parts of graphs, hover over data points for precise values, and potentially filter or compare results from different training runs. This level of interactivity transforms raw performance data into understandable trends and patterns. For instance, observing a sudden spike in loss during training might prompt an immediate investigation into data quality or model stability, a task made significantly easier with direct access to detailed loss curves.
Integration and Workflow Impact
The integration of a live post-training dashboard into Mimo signifies a move towards more streamlined MLOps (Machine Learning Operations). By centralizing evaluation within the platform, Xiaomi is reducing the need for disparate tools and scripts. This can lead to a more cohesive and efficient workflow, particularly for teams that are scaling their machine learning initiatives. The dashboard acts as a single source of truth for post-training analysis, improving collaboration and reducing the chances of misinterpretation that can arise from fragmented reporting.
For developers, this means less time spent on data wrangling and report generation and more time focused on model improvement and deployment. The ability to quickly assess a training run's success or failure allows for faster iteration. If a model performs poorly, the developer can immediately pivot to diagnose the issue using the detailed metrics provided, rather than waiting for a scheduled report that might be hours or days old. This agility is critical in competitive AI development landscapes.
Broader Implications for Model Development
The introduction of such a dashboard reflects a broader industry trend towards making machine learning development more accessible and efficient. As models become more complex and datasets grow, the need for sophisticated yet user-friendly tools for monitoring and evaluation intensifies. Mimo's approach, by providing live, integrated post-training analysis, is directly addressing this need. It democratizes access to critical performance data, empowering a wider range of users, not just seasoned ML engineers, to understand and improve their models.
This feature could also have implications for model governance and reproducibility. By providing a clear, auditable record of performance metrics tied directly to specific training runs, the dashboard aids in tracking model evolution and ensuring that deployed models align with their evaluated performance. It establishes a baseline for comparison and a clear record of outcomes, which is invaluable for debugging, compliance, and continuous improvement efforts. The real-time nature of the dashboard means that any anomalies or deviations from expected performance can be flagged almost instantaneously, facilitating proactive problem-solving.
The Unanswered Question: Scalability and Customization
While the live post-training dashboard in Mimo 2.6 is a significant step forward, an important question remains: how well will it scale with extremely large-scale training operations and how customizable will it be for highly specialized use cases? For organizations training hundreds or thousands of models concurrently, or those with unique evaluation metrics beyond the standard set, the current iteration's capabilities will be put to the test. Future updates will likely need to address granular control over displayed metrics, integration with custom logging frameworks, and performance optimization for massive datasets and training jobs to truly serve all segments of the ML community.