The Power of Growing Dividends: SCHD's Advantage
Many investors focus on the starting dividend yield of an ETF, often overlooking a more critical factor: dividend growth. Schwab's U.S. Dividend Equity ETF (SCHD) frequently appears on lists of top dividend ETFs, but its true strength lies not in its initial yield, which is modest at around 3-4%, but in its consistent dividend growth. Over its history, SCHD has demonstrated an impressive dividend growth rate of approximately 10-12% annually. This compounding effect is crucial. A static 6% yield, while attractive initially, can eventually be surpassed by a smaller starting yield that steadily increases over time. To make this mathematical advantage tangible, a dedicated SCHD dividend calculator has been developed, powered by a small, open-sourced TypeScript library called dividend-math.
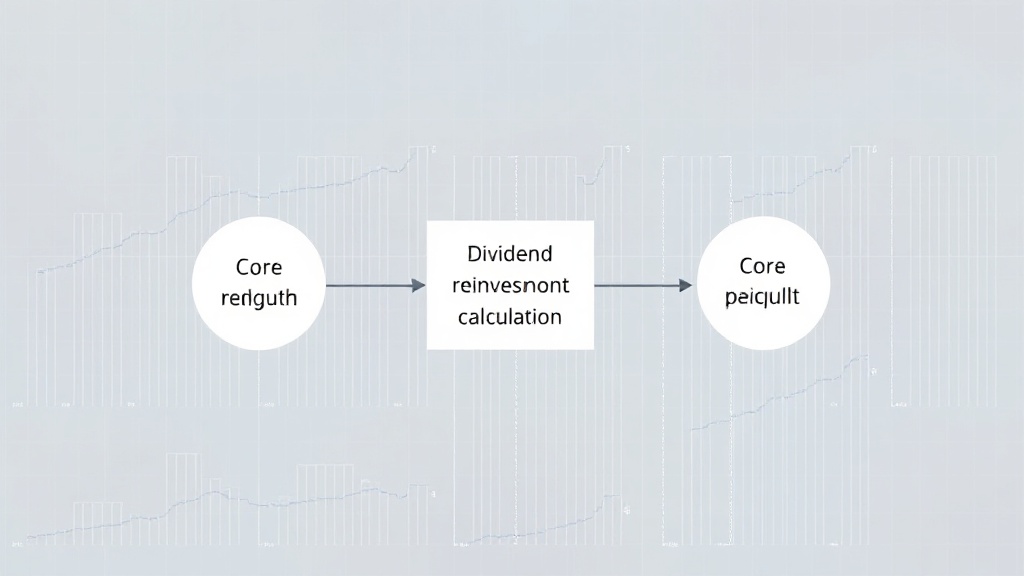
The library's core functionality is encapsulated in a pure function, dripCalculator. This function simulates dividend growth and reinvestment year by year, allowing users to visualize the long-term impact of SCHD's compounding dividend payouts. The model considers the ETF's historical dividend growth rate and the principle of dividend reinvestment, demonstrating how consistent growth outpaces stagnant, albeit higher, initial yields.
Inside the dividend-math Library
The dividend-math library is designed for simplicity and reusability, focusing on the core mechanics of dividend growth and reinvestment. Its primary function, dripCalculator, takes several parameters to model the investment scenario:
initialInvestment: The starting amount invested.initialDividendYield: The ETF's starting yield as a decimal (e.g., 0.035 for 3.5%).dividendGrowthRate: The projected annual growth rate of the dividend, also as a decimal.years: The number of years to simulate.reinvestDividends: A boolean flag indicating whether dividends should be reinvested.
The function iterates through the specified number of years. In each year, it calculates the dividend income based on the current investment value and the dividend yield. If dividend reinvestment is enabled, this income is added to the principal, effectively compounding the investment. The dividend growth rate is then applied to the dividend payout for the subsequent year. This iterative process allows for a clear visualization of how the investment grows over time, especially when dividends are reinvested and the dividend payout itself grows year after year.
The SCHD Dividend Calculator: A Practical Application
The dividend-math library serves as the engine for a user-friendly online calculator specifically for SCHD. This calculator allows investors to input their own hypothetical investment amounts and time horizons to see the potential outcomes of investing in SCHD. By leveraging the library's precise calculations, the calculator can illustrate the power of SCHD's dividend growth. For instance, an investor might input an initial investment of $10,000, an assumed starting yield of 3.5%, and a dividend growth rate of 10% per year, simulating the investment over 20 years with dividend reinvestment enabled.
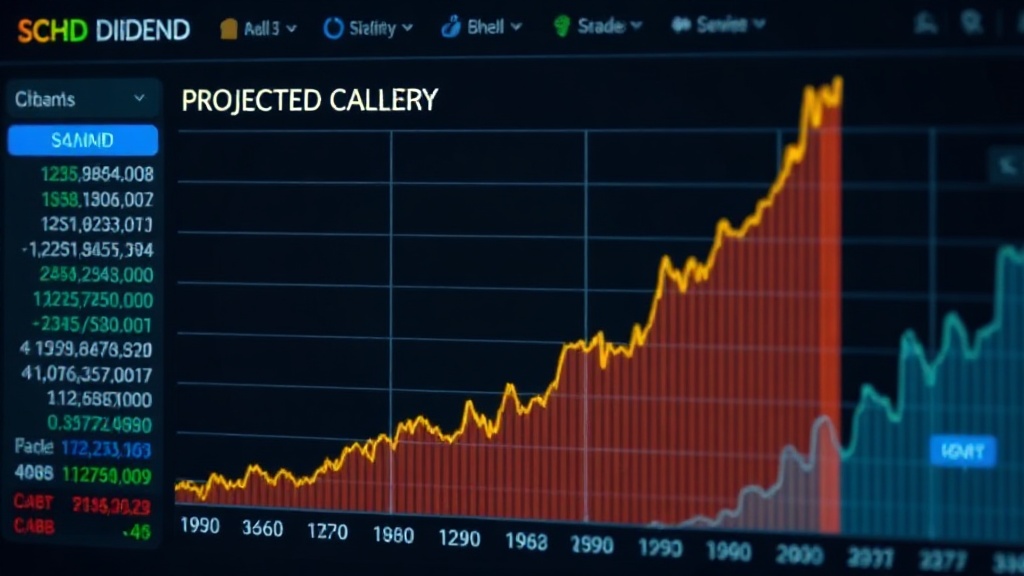
The calculator's output provides a year-by-year breakdown of the investment's growth, total dividends received, and the final portfolio value. This granular detail helps users understand the compounding effect in action. The surprising detail here is not just the projected growth, but how the reinvested dividends, bolstered by the increasing payout, contribute a disproportionately larger share of the total return in later years. This contrasts sharply with investments that lack a significant dividend growth component, where the initial yield remains the primary, and often stagnant, driver of returns.
Modeling Assumptions and Limitations
It is critical to understand that any model, including the one powering dividend-math and the SCHD calculator, relies on assumptions about future performance. The library uses historical data for SCHD's dividend growth rate (around 10-12%) as a projection for future growth. However, past performance is not indicative of future results. Factors such as economic downturns, changes in company holdings within the ETF, or shifts in corporate dividend policies could cause the actual dividend growth rate to deviate from historical averages.
Furthermore, the model typically assumes a constant reinvestment of all dividends received at the ETF's current price. In reality, an investor might choose to take some dividends as income, or market fluctuations could mean the price at which dividends are reinvested varies. The dripCalculator function, being a pure function, abstracts away these real-world complexities to focus on the core mathematical relationship between yield, growth, and compounding. Users of the calculator should view the results as projections based on specific inputs and assumptions, rather than guaranteed outcomes. The primary value lies in demonstrating the *potential* power of a growing dividend stream.
Broader Implications for Dividend Investors
The development and open-sourcing of dividend-math highlight a growing trend among developers and investors to create transparent, accessible tools for financial analysis. By abstracting the complex calculations into a reusable TypeScript library, the creator has enabled others to build upon this work, fostering a community around data-driven investment strategies. For developers interested in personal finance or quantitative analysis, this library provides a solid foundation for exploring various investment scenarios.
For dividend investors, the core takeaway is reinforced: focus on dividend growth, not just starting yield. An ETF like SCHD, with a history of steadily increasing its payouts, can lead to significantly higher total returns over the long term when dividends are reinvested, compared to ETFs with higher but stagnant yields. This analytical approach, powered by tools like dividend-math, empowers investors to make more informed decisions by quantifying the long-term benefits of compounding dividend growth. The ability to model these scenarios in TypeScript means that these calculations can be integrated into broader financial dashboards or custom investment tools, providing deeper insights into portfolio performance.