The Illusion of Healthy Infrastructure
For years, many engineering teams have operated under a dangerous assumption: if system resource metrics like CPU, memory, and request counts look good, the application is healthy. This belief is often reinforced by dashboards that show all green lights. However, reality frequently diverges from this picture. "Green dashboard, angry customer" scenarios become common, highlighting a critical gap: we were watching the machine, not the request. A service can operate well within its resource limits and still fail its primary purpose – delivering correct and timely responses to users.
This disconnect between infrastructure health and user experience is where significant observability investment is often wasted. The solution isn't necessarily a new, expensive tool. Instead, it lies in a fundamental shift in what we log and how we visualize it. By logging three specific events for each request and configuring dashboards to monitor them, we can gain a true understanding of system performance from the user's perspective.
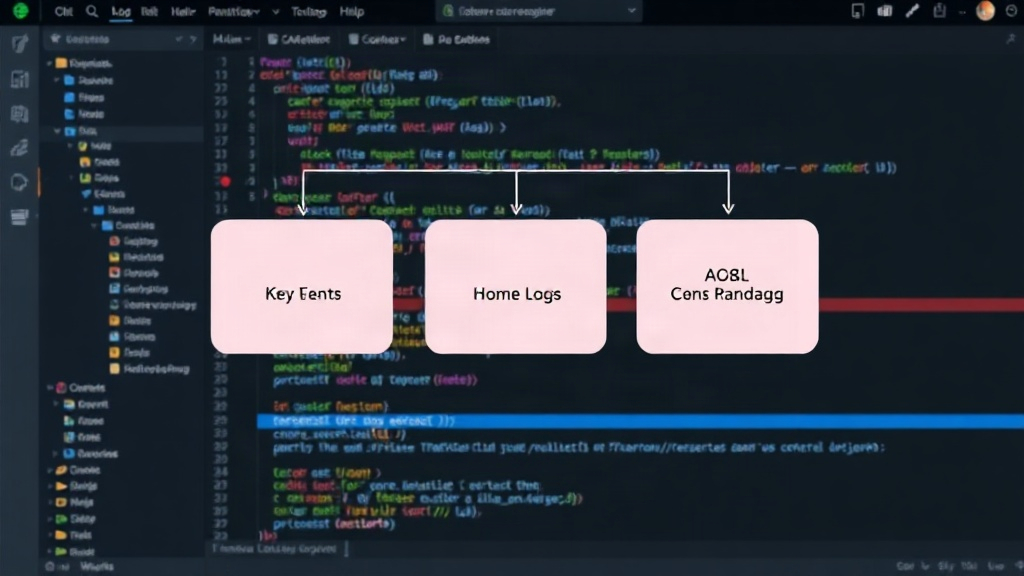
The Three Essential Events
To bridge the gap between infrastructure metrics and user experience, we need to track three critical events associated with each user request. These events provide tangible data points that directly reflect whether a request was successful and timely from the user's viewpoint.
1. Request Start Event
The first event marks the beginning of a request. This is straightforward: when a request enters the system, log an event indicating its start. This event should ideally include a unique request ID that will be propagated through all subsequent events related to this specific request. This ID is crucial for correlating different stages of the request lifecycle.
2. Request End Event (Success)
The second event signifies a successful completion of the request. This means the application processed the request, generated a valid response, and is about to send it back to the client. It's important to capture the timestamp of this event. This event confirms that the core business logic of the request was successfully executed. The unique request ID must be included here as well.
3. Request End Event (Failure)
The third event captures the failure of a request. This event is logged when the application encounters an error that prevents it from fulfilling the request successfully. This could be due to a business logic error, an unhandled exception, or any condition that results in a non-successful outcome for the user. Again, the timestamp and the unique request ID are vital. This event helps identify not just that something went wrong, but also when and within which request context.
Correlating Events for SLOs
The power of these three events comes from correlating them using the unique request ID. By analyzing the time difference between the 'Request Start' and 'Request End' events (both success and failure), we can accurately measure the latency of each request. This provides a direct measure of performance as experienced by the user.
Furthermore, by distinguishing between 'Request End (Success)' and 'Request End (Failure)' events, we can calculate the error rate. This is far more meaningful than simply looking at HTTP 5xx error codes, which might not capture all forms of failure or might include errors that are not user-impacting.
Building the SLO Dashboard
With these three events logged, we can construct dashboards that directly reflect Service Level Objectives (SLOs). Instead of relying on aggregate infrastructure metrics, we can create:
- Latency Percentiles: Track p50, p90, p95, and p99 latencies based on the duration between start and end events. This directly shows how fast the system is for most users and its tail latency.
- Availability/Error Rate: Calculate the percentage of successful requests versus the total number of requests (successful + failed). This provides a true measure of service availability from the user's perspective.
This approach transforms raw logs into actionable insights, providing a clear view of user experience and system reliability. It moves observability from a reactive, infrastructure-focused stance to a proactive, user-centric one.
The Unanswered Question: Cost and Granularity
While this method offers superior insight into user experience, a critical question remains unaddressed: what is the optimal granularity for logging these events, and what are the associated costs? Logging every single request with these three events can generate a massive volume of data, potentially leading to significant storage and processing expenses. Conversely, sampling these events too aggressively risks missing critical failures or providing a skewed view of performance. Finding the right balance requires careful consideration of the application's criticality, traffic volume, and budget. The exact sweet spot for this trade-off is not a one-size-fits-all answer and often requires experimentation and continuous tuning. What is the right sampling strategy to ensure SLO accuracy without incurring prohibitive costs?
Beyond the Dashboard: Actionable Insights
This log-centric approach to SLOs is more than just a better dashboard. It's a paradigm shift. When a request fails, the logs associated with that specific request ID can be immediately retrieved. This provides invaluable context for debugging – error messages, stack traces, relevant input parameters, and even preceding events. This drastically reduces the mean time to resolution (MTTR) because engineers aren't sifting through mountains of general system logs; they are looking at the precise logs for the failed request.
For developers, this means moving from abstract metrics to concrete user journeys. They can see exactly where a request failed and why. For SREs and operations teams, it means more reliable SLO reporting and faster incident response. For product managers, it means a clearer understanding of system reliability and user satisfaction. It’s about watching what matters: the user's interaction with the service.