Traditional AI agent development often stops at a simple terminal output: a line indicating a task passed, failed, or requires human intervention. While honest, this feedback is critically insufficient. It tells you nothing about the scope of the agent's actions, which requirements are covered by tests, the historical success rate of those tests, or the root cause of persistent blockers.
The GuardianKane project, an AI agent development framework, addresses this deficiency with a comprehensive verification dashboard. This dashboard moves beyond opaque pass/fail signals to provide deep visibility into the agent's execution and verification status. The rebuild's answer was a dashboard, and it is the part people miss when they hear GuardianKane described as a Stop hook. This is a tour of it, using screenshots from the ecommerce demo, a real project built through the loop and committed with its unedited history. Part 1 covers how the system got here.
The Four-Tab Dashboard Interface
The GuardianKane dashboard, accessible locally at localhost:4173, offers four distinct tabs, each providing a unique lens into the agent's verification process. These tabs are designed to offer granular insights, transforming opaque AI task execution into a transparent, auditable process.
Code Graph
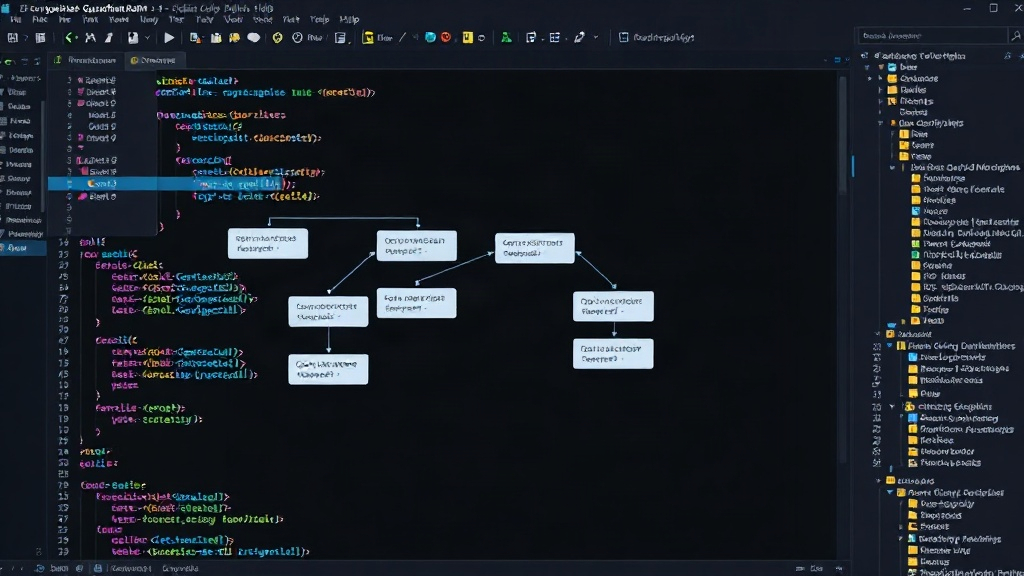
The 'Code graph' tab visualizes the dependencies and execution flow of the agent's tasks. It maps out how different components interact, highlighting which parts of the codebase were accessed or modified during an agent's run. This visual representation is crucial for understanding the blast radius of any given task and for identifying potential unintended side effects. Developers can see at a glance the relationships between tasks, their dependencies, and their overall impact on the project's architecture.
Requirements Coverage
This tab focuses on the verification of project requirements. It lists all defined requirements and indicates whether a test exists for each. More importantly, it shows the historical success rate of these tests, offering a clear picture of how robust the verification suite is and which requirements might be inadequately tested. For each requirement, users can drill down to see the specific tests associated with it, their recent performance, and any associated blockers.
Test History
The 'Test History' tab provides a chronological log of all executed tests. This includes not just the pass/fail status but also detailed metadata such as the execution environment (e.g., browser, local machine), the duration of the test, and any error messages or stack traces generated. This granular data is invaluable for debugging, performance analysis, and understanding the reliability of the verification process over time. It’s like having an exhaustive diary for every single test run.
Blockers
The 'Blockers' tab is dedicated to identifying and diagnosing tasks or tests that are currently failing or have historically been problematic. It aggregates information on recurring failures, provides direct links to relevant error logs, and offers suggestions for remediation. This section acts as a proactive issue tracker, highlighting areas that require immediate attention and preventing the accumulation of technical debt. The surprise here is not just the identification of blockers, but the aggregated, actionable data provided, which often surfaces systemic issues that simple terminal logs would miss.
Beyond Stop Hooks: The Dashboard's Value
GuardianKane is often categorized by its 'Stop hook' functionality – its ability to halt execution upon detecting critical issues. However, the real innovation lies in the transparency provided by its dashboard. The terminal output is merely a symptom; the dashboard is the diagnostic tool that reveals the underlying health of the AI agent's development and verification cycle.
Consider the implications for a team working on a complex e-commerce platform. Without this dashboard, a failed task might mean hours spent manually tracing execution paths, sifting through logs, and guessing at the root cause. With GuardianKane's dashboard, a developer can immediately see which requirement failed, which specific test encountered an error, the environment in which it failed, and if this is a recurring issue. This speeds up debugging from hours to minutes.
Furthermore, the visibility into requirements coverage and test history enables proactive quality assurance. Teams can identify under-tested areas of their application and prioritize the development of new verification routines. The 'Blockers' tab, in particular, transforms potential showstoppers into manageable issues by providing context and historical data. This is akin to a mechanic not just telling you your car broke down, but showing you precisely which part failed, when it started to fail, and offering a clear repair plan.
The commit history of the e-commerce demo project, which is integrated with GuardianKane, is crucial. It provides an unedited record of the development process, showcasing how the agent interacted with the codebase and how its verification status evolved. This transparency is vital for building trust in AI-assisted development and for maintaining an auditable trail of changes and their verification outcomes.
The Future of Agent Verification
The GuardianKane dashboard represents a significant step forward in making AI agent development processes more transparent and manageable. By shifting from opaque terminal outputs to rich, interactive visualizations and detailed logs, it empowers developers to understand, debug, and improve their AI agents more effectively. This approach is not just about catching errors; it's about building confidence and providing the necessary insights for continuous improvement in AI-driven software development. The challenge now is how broadly this model of visible verification will be adopted across the AI development landscape.