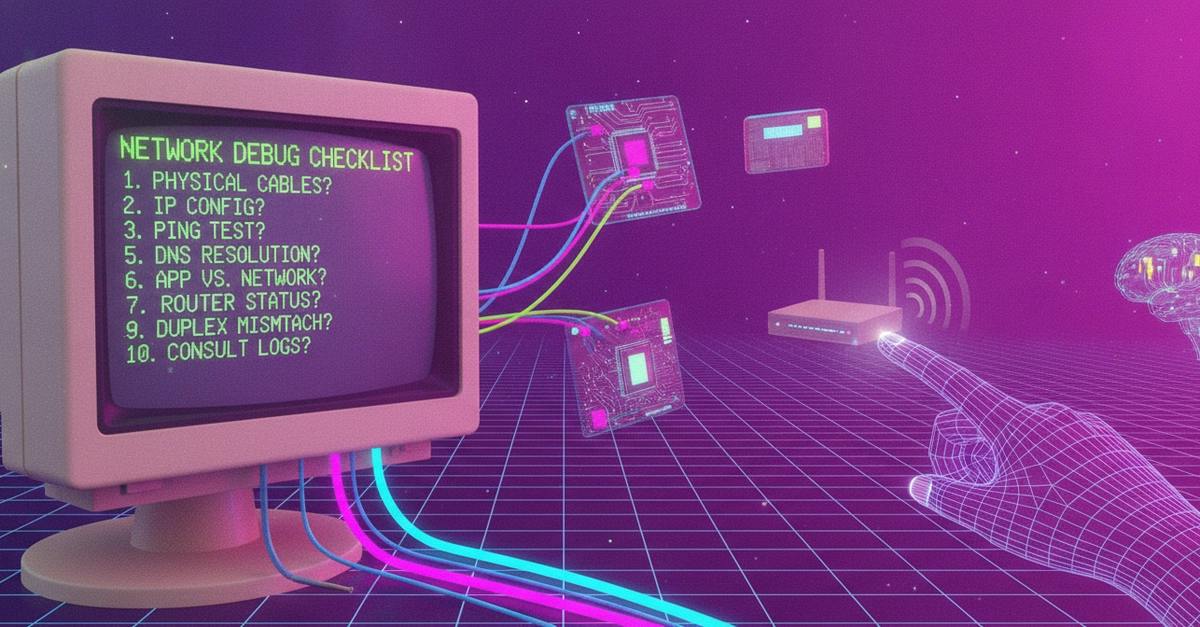
The Network Debugging Checklist: A Systematic Approach
The phrase "It's probably a network issue" often signals the end of productive debugging. This happens not because the assessment is wrong, but because a systematic method to confirm or deny network involvement is missing. Without it, a potential diagnosis devolves into a shrug. This checklist provides a structured approach to systematically troubleshoot network-related problems, moving from the most common and simplest checks to more complex ones.
1. Confirm the Target Service is Healthy
Before diving into network diagnostics, rule out the most basic failure: the target service itself is down or unhealthy. A "connection refused" or a timeout can masquerade as a network problem when, in reality, the destination process isn't running. Always check the target service's own health indicators and logs first. This step is surprisingly often skipped, leading to extensive troubleshooting of DNS, routing, and firewalls when the application process is merely dead.
2. DNS Resolution
DNS is the most common culprit after the service itself. Verify that the hostname you are using resolves to the correct IP address. Use tools like nslookup, dig, or host to query the DNS server.
Check the IP address: Does it match what you expect? Is it an internal or external IP? Is it the correct IP for the environment (dev, staging, prod)?
Check the TTL (Time To Live): If you recently updated DNS records, a high TTL might mean your local or intermediate DNS cache is still serving the old IP. You might need to wait for the TTL to expire or clear relevant caches.
Check DNS propagation: For public-facing services, use a DNS checker tool to see if the new records have propagated globally. Sometimes, a DNS change can take minutes or even hours to reflect everywhere.
3. Connectivity to the IP Address
Once DNS is confirmed, test basic IP-level connectivity. This isolates the problem to the network path itself, separate from application-level issues.
Ping: Use ping <IP_address>. This tests ICMP reachability. While some networks block ICMP, a successful ping is a strong indicator of basic network health. A failed ping could mean a firewall is blocking ICMP, or there's a routing issue.
Traceroute: Use traceroute <IP_address> (or tracert on Windows). This command maps the path packets take to the destination, showing each hop (router) along the way. It's invaluable for pinpointing where packet loss or high latency occurs. Look for hops where the latency spikes significantly or where the requests start timing out.
Port Check: Even if you can ping an IP, the specific port your application needs might be blocked. Use tools like telnet <IP_address> <port> or nc -vz <IP_address> <port>. A successful connection (e.g., a banner for telnet, or a "succeeded" message for nc) means the port is open and reachable. A refusal or timeout indicates a block, potentially by a firewall, or that the service isn't listening on that port.
4. Firewall and Security Group Rules
Firewalls and cloud provider security groups are common choke points. These are often the silent killers of network traffic.
Client-side firewalls: Check firewalls on your local machine or the server initiating the connection. Ensure outbound rules allow traffic to the destination IP and port.
Server-side firewalls/Security Groups: Verify that inbound rules on the destination server's firewall (e.g., `iptables`, `ufw`) or cloud security groups (e.g., AWS Security Groups, Azure Network Security Groups) permit traffic from your source IP and to the required port.
Network Firewalls: In larger organizations, dedicated network firewalls between subnets or data centers can also block traffic. Consult network administrators if you suspect this is the case.
5. Routing and Network Configuration
If basic connectivity and firewall rules seem fine, the issue might be with how traffic is being routed.
Subnet and Gateway: Ensure your machine is on the correct subnet and has a valid default gateway configured. If you're in a cloud environment, check your Virtual Private Cloud (VPC) or Virtual Network (VNet) routing tables. Are there routes defined to reach the destination network?
Network Address Translation (NAT): If you are connecting from a private network to a public service, or vice-versa, NAT devices can be involved. Verify NAT configurations are correct and not causing conflicts.
VPN/Proxy Issues: If you are using a VPN or proxy, test connectivity with and without it. VPNs can alter routing and introduce their own points of failure. Proxies might be misconfigured or blocking certain types of traffic.
6. Application-Specific Network Settings
Sometimes, the network configuration is buried within the application itself.
Bind Addresses: Services often have a configuration option for the IP address they listen on (e.g., 0.0.0.0 to listen on all interfaces, or a specific IP). Ensure the service is bound to an interface that is accessible from where you are trying to connect.
Configuration Files: Check application configuration files for any network-related settings that might be incorrect, such as incorrect hostnames, ports, or protocol settings.
7. Intermediate Network Devices and Services
In complex environments, other network devices can interfere.
Load Balancers: If traffic goes through a load balancer, check its health and configuration. Is it routing traffic to healthy backend instances? Is it configured with the correct ports and protocols?
Reverse Proxies: Similar to load balancers, reverse proxies can introduce issues if misconfigured or overloaded.
Network Address Translation (NAT) Gateways: Ensure NAT gateways are correctly configured to allow traffic between different network segments.
8. Packet Analysis (Advanced)
When all else fails, and you need to see exactly what packets are being sent and received, packet analysis tools are your best friend.
tcpdump/Wireshark: Use tcpdump on the server or client to capture network traffic. You can then analyze the capture file with Wireshark. This allows you to see raw packets, identify retransmissions, malformed packets, and the exact nature of the connection attempts and failures. This is deep diving, but incredibly powerful for uncovering subtle network issues.
Key things to look for:
- SYN packets being sent but no SYN-ACK received (indicates the packets aren't reaching the destination or the response is lost).
- RST (Reset) packets being sent back (indicates the connection was actively refused, often by a firewall or the application).
- Excessive retransmissions (indicates packet loss).
- High latency between request and response.
By systematically working through this checklist, you can move from educated guesses to data-driven diagnosis, significantly reducing the time spent on network troubleshooting and increasing the accuracy of your solutions.