The Performance Bottleneck of JavaScript Chart Libraries
Interactive charts and optimal web performance often seem at odds. The conventional approach involves loading a JavaScript charting library, typically weighing 50-150 KB, followed by a period of hydration where the browser renders a blank space until the JavaScript executes. This process can significantly delay the display of useful content and negatively impact Core Web Vitals, specifically metrics like First Contentful Paint (FCP) and Largest Contentful Paint (LCP), as well as Cumulative Layout Shift (CLS) if the chart's structure changes during hydration. The main thread becomes a bottleneck, parsing and executing JavaScript that could otherwise be used for more critical rendering tasks. This cost is incurred on every page load, even for users who may not interact with the chart.
The core issue isn't the interactivity itself, but the default method of achieving it. Traditional JavaScript charting stacks prioritize a dynamic, client-side rendering model. This means the browser must download, parse, and execute a significant amount of JavaScript before any visual representation of the data can appear. This delay directly translates to a worse user experience and poorer performance metrics, which search engines increasingly use as ranking signals. For developers aiming for perfect Lighthouse scores, this presents a persistent challenge: how to deliver rich, interactive data visualizations without sacrificing page load speed and responsiveness.
The Paint-First Pipeline: A Progressive Enhancement Strategy
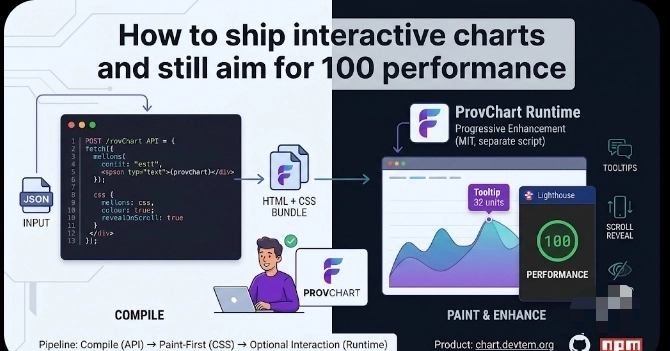
A more performant strategy is the paint-first pipeline. This approach prioritizes rendering the chart's visual elements using native browser capabilities – HTML and CSS – before client-side JavaScript is involved. The process begins by compiling the chart data directly into HTML and CSS structures. This HTML/CSS representation is then included in the initial server response, allowing the browser to render the chart's static visual appearance on first paint. Interaction is layered on top as a progressive enhancement, meaning JavaScript is loaded and executed later to add dynamic features like tooltips, zooming, or filtering. This ensures that users see meaningful content immediately, even on slower connections or less powerful devices. Think of it less like a complex application loading all its features at once, and more like a beautifully printed poster that reveals interactive elements only when you decide to engage with them.
This method fundamentally shifts the rendering order. Instead of waiting for JavaScript to construct the chart's visual representation, the chart is already present in the initial HTML. The browser's rendering engine handles the layout and styling of the chart elements efficiently. JavaScript's role is then reduced to enhancing this existing structure, rather than creating it from scratch. This significantly reduces the Time to Interactive (TTI) and improves FCP/LCP. The download and parse costs are also dramatically reduced, as there's no need to download a large charting library for the initial paint. The chart library, if needed at all, is only fetched for interactivity, potentially asynchronously or on user demand.
Implementing Paint-First Charts with CSS
The practical implementation of a paint-first pipeline involves leveraging CSS for visual representation. For bar charts, this could mean generating `
For more complex charts, such as scatter plots or even basic line charts, SVG (Scalable Vector Graphics) offers a powerful, CSS-friendly format. The server can generate SVG markup directly, defining `
Progressive Enhancement for Interactivity
Once the static chart is rendered and visible, JavaScript can be introduced to layer interactivity. This can be done asynchronously or after the main page load has completed. For the paint-first approach, JavaScript's role is to enhance the existing HTML/CSS structure. If a user hovers over a bar, JavaScript can read data attributes associated with that bar (e.g., `data-value`, `data-label`) and display a tooltip. For line charts, JavaScript can handle more complex interactions like zooming, panning, or displaying detailed data points on hover, potentially by adding event listeners to the SVG elements or a dedicated overlay. This is the progressive enhancement aspect: the core information is accessible immediately, and richer interactions become available as the JavaScript loads and executes. This ensures a baseline experience for all users, regardless of their device's capabilities or network conditions.
The key is to decouple the rendering of the chart's static visual representation from the JavaScript code that handles dynamic interactions. This means the JavaScript does not need to be responsible for calculating positions, drawing shapes, or managing the DOM structure for the initial display. Instead, it can focus on tasks like event handling, data fetching for dynamic updates, or manipulating existing elements. For developers, this requires a shift in thinking: build for the static case first, then enhance. This can be achieved through server-side rendering (SSR) frameworks that generate HTML/CSS, or through client-side build processes that pre-render chart components into static HTML before hydration. The final JavaScript bundle can be smaller and more targeted, focusing only on the interactive features, and can be loaded with `defer` or `async` attributes to avoid blocking the main thread.
The Trade-offs and When to Use This Approach
The primary benefit of the paint-first strategy is a significant performance improvement, particularly for initial page load and Core Web Vitals. Users see the chart much faster, and the main thread is less burdened. However, there are trade-offs. Implementing complex charts entirely with HTML/CSS and then enhancing them with JavaScript can be more labor-intensive than using a comprehensive JavaScript charting library. Debugging can also be more challenging, as you're managing rendering logic across server-side compilation, CSS styling, and client-side JavaScript. Furthermore, highly dynamic or real-time updating charts might be more complex to implement with this layered approach, though not impossible.
This approach is ideal for dashboards, reports, and data visualizations where the primary goal is to convey information quickly. It excels in scenarios where a large number of charts appear on a single page, as the cumulative JavaScript overhead of traditional libraries would be prohibitive. If your application serves content to users with variable network conditions or older devices, the paint-first method provides a more equitable and performant experience. It’s also a strong choice for SEO-critical pages where fast rendering of content is paramount. For applications that require extremely complex, highly interactive visualizations with real-time data streams and intricate user manipulations, a pure JavaScript approach might still be necessary, but even then, considering a hybrid model where static elements are pre-rendered could offer benefits.
What nobody has addressed yet is the long-term maintenance cost of custom HTML/CSS chart generation logic versus the benefit of a mature, well-supported JavaScript charting library. As browser capabilities evolve and CSS becomes more powerful, the line between what needs JavaScript and what can be handled natively will continue to shift, potentially making this paint-first paradigm even more compelling.
Referenced Sources
- verified