The Expanding Orbital Environment
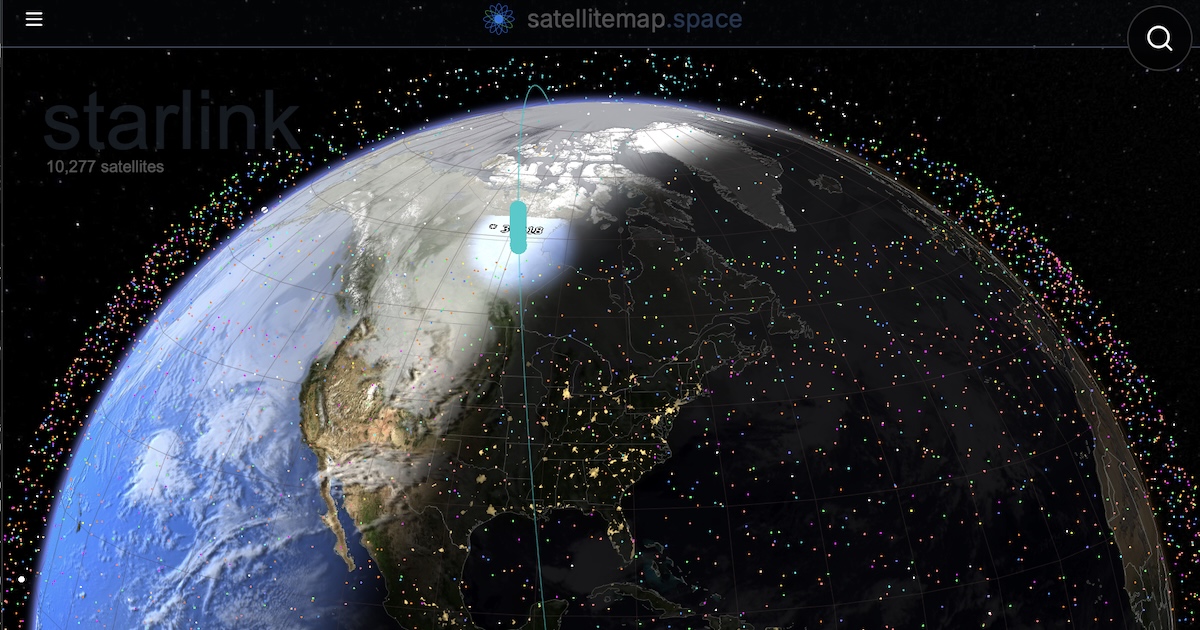
A new, highly detailed interactive map is now available, providing a real-time visualization of the thousands of satellites currently orbiting Earth. The project, accessible at satellitemap.space, goes beyond simply tracking Starlink satellites to encompass a much broader spectrum of orbital objects, reportedly showing over 30,000 individual satellites. This tool offers an unprecedented view into the increasingly crowded space environment, a subject of growing importance for astronomers, aerospace engineers, and policymakers alike.
The map allows users to pan and zoom across a 3D representation of Earth's orbit, with each satellite depicted as a distinct point of light. Users can filter the displayed objects, focusing on specific constellations like SpaceX's Starlink, or viewing satellites by their country of origin or operational status. The sheer density of objects, particularly in low Earth orbit (LEO) where many communication and Earth observation satellites reside, becomes immediately apparent. This visualization serves as a stark reminder of humanity's expanding footprint beyond our atmosphere.
Starlink's Dominance and the Broader Satellite Landscape
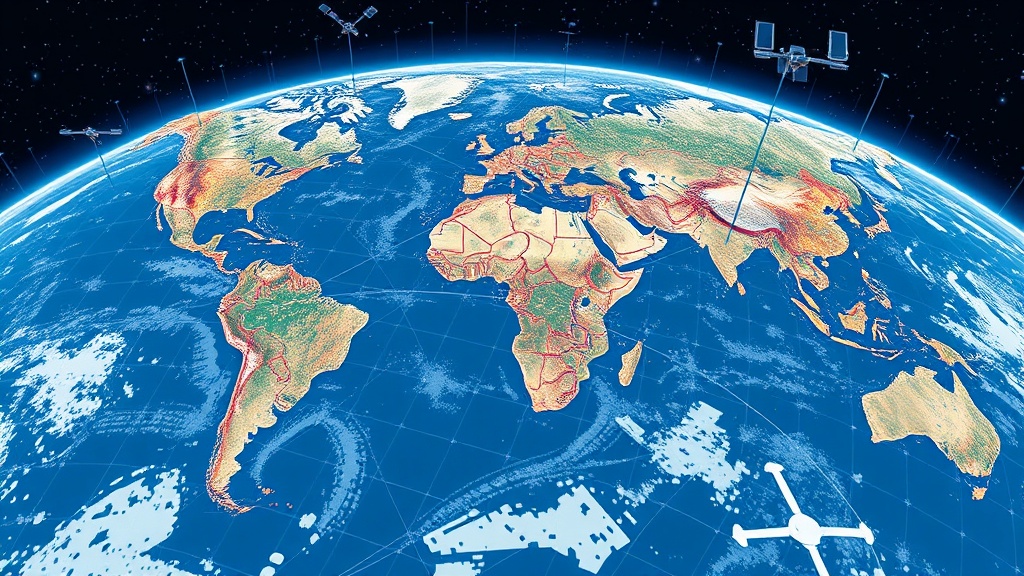
SpaceX's Starlink constellation is a significant contributor to the satellite population, with thousands of its user terminals and orbital satellites visible on the map. The rapid deployment of Starlink has been a key driver in the recent surge of orbital objects. However, the map also highlights a diverse range of other satellites, including those from national space agencies (like NASA, ESA, Roscosmos), other commercial entities (e.g., OneWeb, Amazon's Project Kuiper), scientific research satellites, and even defunct objects that still pose a collision risk.
The ability to filter by country or operator is particularly insightful. It allows observers to see the distribution of space assets among different nations and companies. For instance, the United States and China are consistently among the top operators, reflecting their significant investments in space technology. The map also allows for tracking individual satellites, providing information such as their altitude, inclination, and orbital period. This level of detail is crucial for understanding orbital dynamics and potential interference.
The project is a testament to the increasing availability of orbital data, which is often shared by space agencies and tracking organizations. By aggregating and presenting this data in an intuitive, visual format, satellitemap.space makes complex orbital mechanics accessible to a wider audience. It transforms abstract orbital data into a tangible, almost geographic, representation of our activities in space.
Implications for Space Operations and Astronomy
The visualization provided by satellitemap.space has significant implications. For satellite operators, it offers a clear picture of the competitive and collaborative landscape. Understanding the density and trajectories of other objects is paramount for collision avoidance maneuvers, which are becoming increasingly frequent and complex. The potential for cascading collisions, known as the Kessler Syndrome, is a constant concern in such a crowded environment, and tools like this map help illustrate the risk.
For astronomers, the growing number of satellites, especially bright constellations like Starlink, poses a challenge to ground-based observations. Light pollution from these satellites can interfere with sensitive telescopes, impacting scientific research, particularly in areas like wide-field surveys and the search for near-Earth asteroids. The map’s ability to show the density of satellites in different orbital shells can help astronomers understand where these interference issues are most likely to occur and plan their observations accordingly.
The project also serves as an educational tool, demystifying the complex world of space traffic management. It provides a visual anchor for discussions about space sustainability, regulation, and the future of orbital utilization. As more nations and private companies invest in space-based assets, the need for robust tracking, data sharing, and international cooperation on space traffic management will only intensify. The satellitemap.space project offers a compelling glimpse into the current state of this dynamic and rapidly evolving domain.
The sheer number of objects, exceeding 30,000, underscores the rapid growth of space activities. This growth is driven by commercial interests, scientific exploration, and national security needs. The map helps to contextualize this expansion, making the invisible realm of Earth's orbit visible and understandable. It is a resource for anyone curious about what lies above us and how our presence in space is evolving.