Redis City: A Visual Journey Through Data Structures
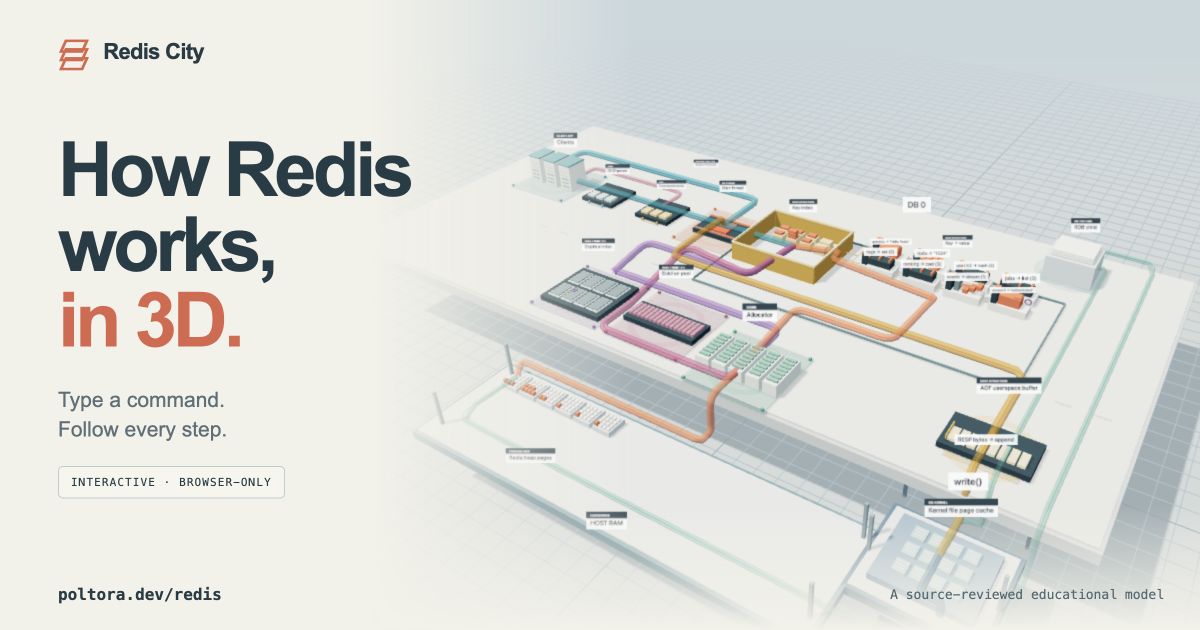
Exploring the inner workings of a complex database system like Redis has historically been a text-heavy endeavor. Developers typically rely on documentation, command-line interfaces, and abstract diagrams to understand how data is stored, accessed, and managed. Now, a new open-source project, dubbed "Redis City," aims to change that by offering an interactive, three-dimensional model of Redis. This innovative approach allows users to visualize and interact with Redis data structures in a way that makes abstract concepts tangible and comprehensible.
Redis City transforms the familiar key-value store into a navigable cityscape. Keys become buildings, and the data structures associated with those keys are represented by the buildings' forms and internal layouts. This project is not just a static visualization; it's an interactive learning tool designed to demystify the performance characteristics and underlying mechanisms of Redis. By walking through this digital city, developers can gain a deeper, more intuitive understanding of how Redis handles different data types, such as strings, lists, sets, sorted sets, and hashes, and how these structures impact operations.
The project, shared on Hacker News under the "Show HN" tag, immediately garnered attention from the Redis community. The core idea is to make learning Redis more engaging and accessible. Instead of just reading about how a Redis list occupies contiguous memory or how a hash might be implemented using a hash table, users can see these concepts represented visually. For instance, a Redis list might be depicted as a linear sequence of connected blocks, while a sorted set could be represented by a structure that visually implies ordering and efficient retrieval.
Interactive Exploration and Learning
The power of Redis City lies in its interactivity. Users can navigate the city, select individual buildings (keys), and inspect their internal structures. This hands-on approach allows for experimentation and immediate feedback, which is crucial for deep learning. Imagine being able to "fly" into a building representing a complex Redis hash and see the key-value pairs arranged within its virtual walls. Or visualize the probabilistic nature of a Redis HyperLogLog by observing its representation and understanding how it approximates cardinality with remarkable efficiency.
This visualization extends to understanding Redis operations. For example, when a command is executed that modifies a data structure, the corresponding building in Redis City can animate or change its appearance to reflect the alteration. This provides a dynamic understanding of operations like `LPUSH` (adding to a list), `SADD` (adding to a set), or `ZADD` (adding to a sorted set). The project aims to serve as an educational resource, helping newcomers grasp fundamental concepts and experienced users explore advanced features and performance nuances without getting lost in dense documentation.
The developers behind Redis City have focused on translating the logical representation of data into a spatial one. This is akin to how architects use 3D models to convey complex building designs. In Redis City, the "architecture" of data structures becomes visible. For instance, the difference between a Redis Set (unordered collection of unique strings) and a Redis Sorted Set (ordered collection of strings, each associated with a score) can be starkly illustrated by the geometric properties and internal organization of their respective building representations. A Set might be a simple, uniform block, while a Sorted Set could be a multi-tiered structure with elements clearly arranged by their associated scores.
Broader Implications for Developer Education
The trend towards visual and interactive learning tools is growing across the tech industry, especially in areas involving complex systems. Traditionally, understanding databases, operating systems, or network protocols required significant theoretical study. Projects like Redis City, however, are part of a wave that uses gamification and immersive visualization to make these topics more approachable. This can significantly lower the barrier to entry for new developers and provide seasoned professionals with novel ways to deepen their understanding or onboard new team members.
What remains to be seen is how widely such interactive models will be adopted. While Redis City is an open-source project and freely available, its effectiveness will depend on its integration into developer workflows and educational curricula. Will this become a standard tool for learning Redis, or will it remain a niche curiosity? The project's success could inspire similar 3D visualizations for other complex software systems, potentially revolutionizing how developers learn and interact with technology at a fundamental level.
The developers have not yet detailed plans for extending Redis City to cover more advanced Redis features, such as clustering, replication, or persistence mechanisms. However, the foundational architecture of a navigable 3D environment capable of representing complex data relationships suggests a strong potential for future expansion. For now, Redis City stands as a compelling demonstration of how creative visualization can illuminate the intricate world of data management, making it a valuable resource for anyone working with Redis.
The project is available as an open-source initiative, inviting contributions and further development from the community. This collaborative spirit is crucial for evolving such a tool into a comprehensive educational platform. By turning abstract data structures into a physical, explorable space, Redis City offers a unique perspective on one of the most widely used in-memory data stores, making its internal mechanics accessible and intuitive.