The Unexpected Performance Bottleneck
In July, a seemingly simple shell script, mcp-optional, was deployed with the sole purpose of removing two specific MCP servers from a configuration. This wasn't a fix; it was an excision. These servers, identified as stdio types, were each spawning a dedicated Node.js process for every active session. On a 16GB M4 machine handling around 13 Claude Code sessions, this translated to a substantial RAM overhead—approximately 1.4GB duplicated—leading to swap thrashing and an overheated laptop. Disabling these servers by default, with an option to re-enable them on demand, resolved the immediate memory issues.
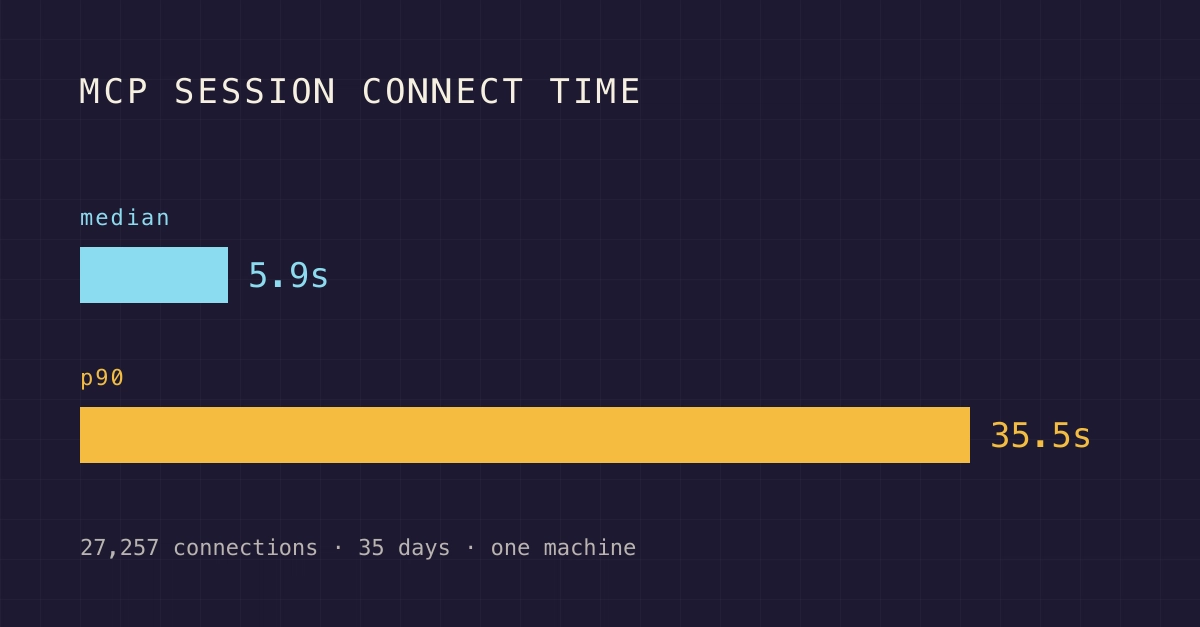
The problem was filed away as a solved memory concern. However, a recent investigation into Claude Code's connection logs unearthed a more insidious issue: one of the removed servers was not merely a memory drain but also the slowest point of connection by a considerable margin. The surprising detail here is not the server's code itself, but the underlying reasons for its extreme latency, which became apparent after analyzing 35 days of connection logs.
The raw data, collected in JSONL format by Claude Code for each MCP server, paints a clear picture of performance degradation. The author's initial script, though small at 56 lines, effectively isolated and removed the problematic servers, highlighting a critical but previously unrecognized performance bottleneck within the Claude Code infrastructure.
Methodology and Data Collection
The measurement process involved capturing connection logs generated by Claude Code for each active MCP server. These logs are recorded in JSONL (JSON Lines) format, meaning each line in the log file is a self-contained JSON object. This format is efficient for streaming and processing large volumes of log data.
Over a period of 35 days, these logs were collected and analyzed. The primary metric of interest was the session wait time, specifically focusing on the 90th percentile (p90). The p90 metric indicates that 90% of sessions experienced a wait time less than or equal to this value, with the remaining 10% experiencing longer waits. This percentile is crucial for understanding the experience of the majority of users while also acknowledging the tail-end performance that can significantly impact user satisfaction.
The script mcp-optional, initially designed to offload memory pressure, inadvertently became the tool for identifying this performance issue. By removing two specific MCP servers, the author could isolate the impact of each server on overall system responsiveness. The logs revealed that one of these servers, despite having seemingly innocuous code, was consistently responsible for the longest session wait times.
Analysis of Session Wait Times
The analysis of the 35 days of logs revealed a stark contrast in performance between different MCP servers. While most servers handled connections with minimal latency, one particular server consistently exhibited high wait times. The p90 session wait time for this server was measured at a staggering 35 seconds.
This figure is significant because it represents the experience of a substantial portion of users connecting through that specific MCP server. A 35-second wait before a session can even begin is not merely inconvenient; it can render the service unusable for many, leading to frustration and abandonment. For an application like Claude Code, where rapid access to AI models is critical, such delays are unacceptable.
The author's initial diagnosis of a memory problem, while correct in identifying a resource strain, missed the core performance impact. The duplication of Node.js processes per session on stdio servers created a system-wide issue that manifested as swap thrashing. However, the log analysis pinpointed that the latency wasn't just a byproduct of general system strain; it was concentrated on specific server instances. This suggests that the architecture of these stdio servers, which spawn a process per session, might be inherently inefficient at scale, even when sufficient memory is available. The overhead of process creation and management, combined with network hops and potential queuing within the MCP infrastructure, could be contributing factors.
Implications for System Architecture and Performance Tuning
The findings have direct implications for how developers and system administrators approach the architecture and performance tuning of systems relying on similar MCP (Message Queueing Protocol) or equivalent inter-process communication mechanisms. The conventional approach of addressing performance bottlenecks often focuses on code optimization or hardware upgrades. However, this case highlights the critical importance of analyzing connection logs and understanding the specific latency introduced by different server types and their session management strategies.
The stdio server model, where each session gets its own process, is a common pattern for isolating workloads and managing state. However, as demonstrated, it can lead to significant overhead and scalability issues. For systems requiring high throughput and low latency, alternative architectures might be more suitable. These could include:
- Connection Pooling: Reusing a smaller number of persistent processes across multiple sessions, significantly reducing the overhead of process creation.
- Asynchronous I/O Models: Utilizing event-driven architectures (like Node.js's core strength, but perhaps with a different server implementation) that can handle many concurrent connections with fewer processes.
- Optimized Protocol Handlers: Investigating whether the MCP protocol itself or its specific implementation on these servers introduces unnecessary overhead or delays.
The fact that one server was so dramatically slower than others, even after the memory issue was mitigated, suggests a deeper architectural flaw or configuration problem. It’s less about the code of the application running on the server and more about how the server itself interacts with the MCP layer and manages its connections. Understanding the complete path of a request, from the client to the backend service and back, is essential. This includes scrutinizing the MCP infrastructure, the server process lifecycle, and the logging mechanisms themselves for any hidden performance impacts.
What remains unaddressed is the precise technical reason within the server's interaction with the MCP layer that causes this 35-second p90 wait. Was it a slow handshake? A lengthy authentication process? Or perhaps a backlog in the message queue on the server side before processing could even begin? Pinpointing this specific failure mode is the next crucial step for any team operating similar infrastructure.