The Challenge of Real-Time Crypto Data
The cryptocurrency market operates at breakneck speed. Prices shift by the second, trades execute continuously, and trading volumes fluctuate wildly. For developers, traders, and analysts, staying ahead requires not just access to this data, but the ability to process, store, and visualize it in real time. Traditional batch processing methods fall short, leaving a critical gap between data generation and actionable insight. This project tackles that challenge by architecting a complete, real-time data pipeline. The goal was to create a system that could reliably ingest live data streams, ensure data integrity, and make it immediately available for analysis and monitoring. The chosen stack—PostgreSQL, Debezium, Kafka, JDBC, and Grafana—is designed for resilience and scalability, mirroring the demands of a 24/7 global market.
What began as a straightforward task of extracting data from a cryptocurrency exchange, specifically Binance, evolved into a comprehensive Change Data Capture (CDC) workflow. The core idea is to treat database changes not as mere updates, but as a stream of events that can be propagated and acted upon instantly. This approach is crucial for applications where latency directly impacts decision-making, such as high-frequency trading or dynamic risk management.
Architectural Components and Workflow
The pipeline is built upon several key technologies, each playing a specific role in the end-to-end data flow:
- Data Source (Binance API): The initial data originates from Binance, one of the largest cryptocurrency exchanges. Data points like trade executions, order book updates, and ticker information are continuously generated.
- Initial Data Capture: While the article doesn't detail the initial API extraction into PostgreSQL, it implies this is the first step. A custom script or connector would poll the Binance API and insert this raw data into a PostgreSQL database.
- PostgreSQL as the Source Database: PostgreSQL serves as the foundational database. It stores the captured market data. Crucially, its transactional nature and support for logical replication make it an ideal source for CDC.
- Debezium for Change Data Capture: Debezium is the linchpin for real-time streaming. Configured to monitor PostgreSQL's write-ahead log (WAL), Debezium captures every INSERT, UPDATE, and DELETE operation as an event. It then publishes these events to Kafka topics, effectively turning database changes into a stream of messages. This is more efficient than polling the database or relying solely on application-level triggers.
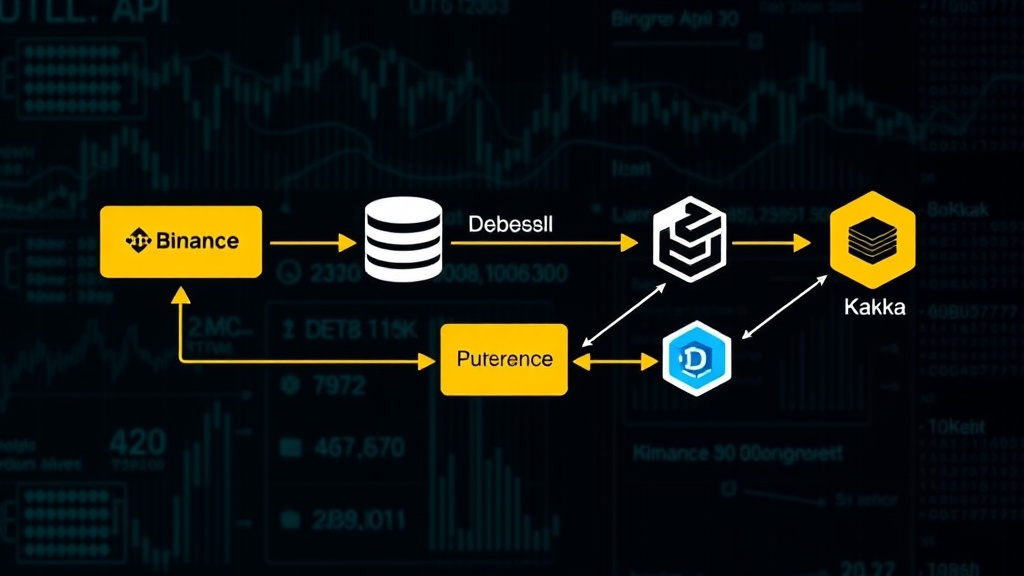
- Apache Kafka as the Message Broker: Kafka acts as the central nervous system of the pipeline. Debezium publishes change events to specific Kafka topics (e.g., one topic per table or data type). Kafka provides durability, fault tolerance, and high throughput, allowing multiple consumers to subscribe to the data stream without impacting the producer. It decouples the data capture from the data consumption.
- JDBC Sink Connector: A Kafka Connect JDBC Sink connector is employed to consume messages from Kafka topics and write them into a designated sink database. This could be another PostgreSQL instance, or a different database optimized for analytical queries. The connector handles deserialization of Kafka messages and performs the corresponding database operations.
- Grafana for Real-Time Visualization: Grafana is the front-end visualization tool. It connects to the sink database (e.g., PostgreSQL) via a JDBC data source. Dashboards are built within Grafana to display key market metrics, such as current prices, trading volumes, price trends, and order book depth, updating in near real time as new data arrives from Kafka.
The Power of Change Data Capture
The integration of Debezium is what elevates this project beyond simple data ingestion. Change Data Capture, when applied to a transactional database like PostgreSQL, provides a highly efficient and reliable method for tracking data modifications. Instead of relying on application-level logic to detect changes or performing costly full table scans, Debezium taps directly into PostgreSQL's WAL. This stream of changes is inherently ordered and complete, ensuring that no data modifications are missed. This is analogous to having a meticulous scribe who records every single alteration made to a ledger, in the exact order they occurred, and then hands over a perfect transcript.
By publishing these changes as events to Kafka, the system creates a robust, fault-tolerant, and scalable data stream. This stream can then be consumed by various downstream applications. In this specific setup, the JDBC Sink Connector is the primary consumer, feeding the data into a queryable datastore. The benefit here is twofold: the original source database (PostgreSQL) is shielded from heavy analytical queries, and the data is readily available for real-time dashboards.
The surprising detail here is not the complexity of the individual components, but how seamlessly they integrate to create a production-grade CDC workflow from what could otherwise be a simple data extraction task. The ability to capture every database change event and stream it reliably is a powerful pattern for any system that requires near real-time data synchronization and analysis.
Building the Dashboards
The final piece of the puzzle is visualizing the data. Grafana, a popular open-source platform for monitoring and analytics, is used to create dynamic dashboards. By connecting Grafana to the sink PostgreSQL database using a JDBC data source, users can query the stored market data and visualize it through various panels, including graphs, gauges, and tables. This allows for immediate monitoring of market conditions, identification of trends, and rapid response to price movements.
Examples of metrics that can be visualized include:
- Current price of various cryptocurrencies.
- Real-time trading volume over different time intervals (e.g., 1 hour, 24 hours).
- Historical price charts with granular time resolution.
- Order book depth and spread.
- Price alerts based on predefined thresholds.
The ability to configure these dashboards to auto-refresh at short intervals (e.g., every 5-10 seconds) ensures that the displayed data remains as current as possible, effectively bridging the gap between the live market and the analyst's screen. If you are responsible for monitoring volatile markets, setting up such a pipeline can provide a critical advantage.
Implications and Future Directions
This architecture demonstrates a scalable and resilient approach to handling high-velocity data streams, applicable beyond just cryptocurrency markets. Financial services, e-commerce, IoT sensor data, and any domain with rapidly changing data can benefit from this pattern. The modular nature of Kafka and Debezium allows for easy addition of new consumers for different purposes, such as real-time fraud detection, machine learning model training, or archival storage.
The core value lies in decoupling data ingestion from data consumption. This allows different teams or applications to access the same real-time data stream independently, without overloading the source system. The chosen technologies are mature, well-supported, and proven in production environments, making this a practical and achievable architecture for many organizations.