Building a Dark-Mode Automotive Telemetry & Chronic Fault Matrix
Developing a robust system for automotive telemetry and chronic fault analysis requires a user interface that is both informative and easy on the eyes, especially during extended use. This project details the construction of such a matrix, implemented with React for the frontend and leveraging Google's Gemini API for intelligent data processing. The focus is on a dark-mode aesthetic, reducing eye strain and improving focus in varying lighting conditions typical of automotive environments or long development sessions.
Core Components and Architecture
The system is architected around several key components. The frontend, built with React, is responsible for rendering the user interface, managing state, and handling user interactions. For data ingestion and analysis, the Gemini API serves as the intelligent backend. This allows for advanced natural language processing capabilities to interpret fault codes, telemetry data patterns, and even generate human-readable summaries of complex vehicle issues. The dark mode is implemented via CSS, ensuring a consistent and visually comfortable experience across all application elements.
React Frontend Implementation
React's component-based architecture is ideal for building complex dashboards. Each piece of information – be it a sensor reading, a historical fault log, or a diagnostic summary – is represented as a self-contained component. This modularity simplifies development, testing, and maintenance. State management is handled efficiently, ensuring that the UI updates dynamically as new telemetry data arrives or as the Gemini API provides analysis results. The choice of React allows for a highly responsive and interactive user experience, critical for real-time monitoring applications.
Leveraging the Gemini API for Fault Analysis
The integration with the Gemini API is central to the system's analytical power. Instead of merely displaying raw fault codes (e.g., P0300), the API can process these codes, cross-reference them with vehicle telemetry (like engine RPM, temperature, O2 sensor readings), and provide a more nuanced understanding of the underlying issue. For instance, Gemini can infer potential causes, suggest diagnostic steps, or even predict the likelihood of a chronic fault reoccurring based on historical data patterns. This moves beyond simple data display to intelligent diagnostics.
Consider a scenario where multiple intermittent misfire codes appear. A traditional system might list these as separate events. However, Gemini can analyze the accompanying sensor data – perhaps noticing a correlation with fuel pressure drops or specific engine load conditions – and suggest a single root cause, such as a failing fuel pump or a clogged injector, presenting this analysis clearly within the dashboard.
Dark Mode Implementation Details
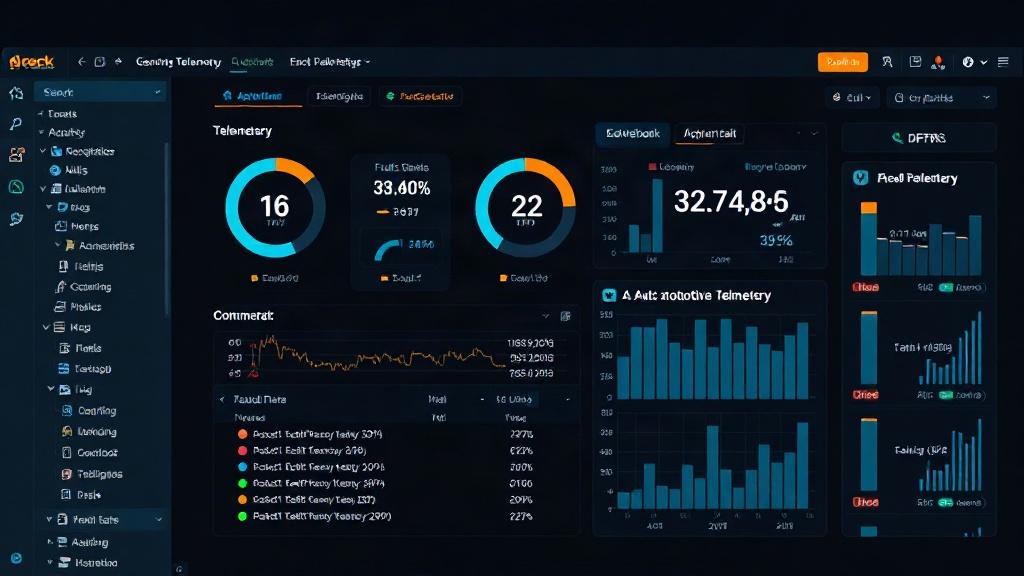
The dark mode theme is applied consistently throughout the application. This involves defining a color palette with dark backgrounds, contrasting text colors, and subtle accent colors for active elements or alerts. CSS variables are extensively used to manage these theme properties, allowing for easy switching between light and dark modes if needed in the future, or even dynamic theme adjustments based on ambient light sensors (though not implemented in this base project). The goal is to minimize blue light emission and reduce visual fatigue, making the dashboard suitable for long-term monitoring without discomfort.
Data Visualization and Chronic Fault Matrix
The 'chronic fault matrix' aspect refers to how historical fault data is presented and analyzed. This isn't just a log of past errors. The system aims to identify recurring issues, patterns of faults that appear together, and the conditions under which they manifest. By visualizing fault frequency, timestamps, and associated telemetry parameters over time, developers and technicians can more easily spot trends indicative of chronic problems. Gemini's analytical capabilities can further enhance this by identifying subtle correlations that might be missed by human observation alone.
For example, the system might highlight that a specific engine temperature range consistently precedes a particular transmission fault. This insight, derived from analyzing historical data points and their temporal relationships, is invaluable for diagnosing complex, intermittent issues that plague automotive systems. The matrix provides a structured way to view this information, making it actionable.
Future Enhancements and Considerations
While this project lays a strong foundation, several enhancements are possible. Real-time data streaming could be integrated for live telemetry feeds. More sophisticated machine learning models, potentially fine-tuned on specific vehicle makes and models, could further improve diagnostic accuracy. User authentication and role-based access would be necessary for production environments. Furthermore, exploring different visualization libraries within React could offer more advanced charting and graphing options for complex datasets.
The core challenge remains in translating raw, often noisy, automotive data into clear, actionable insights. The combination of a well-structured React frontend and the powerful analytical capabilities of the Gemini API offers a promising path forward for building sophisticated automotive diagnostic tools.