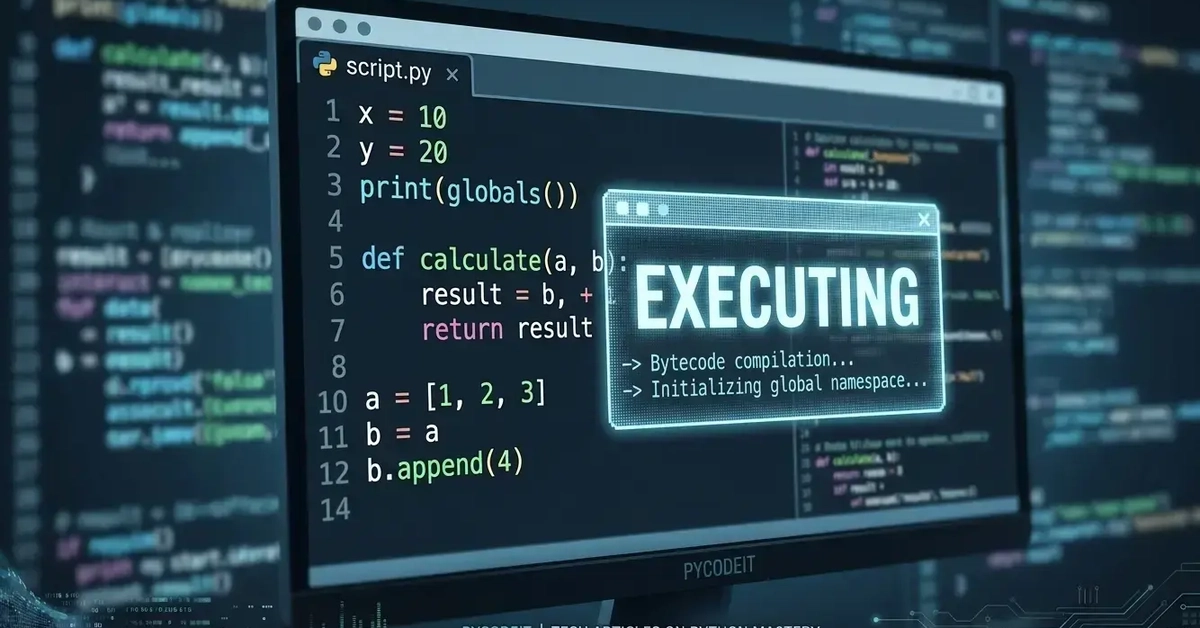
The Python Execution Model: Beyond Syntax
Most Python tutorials focus on what to write, not how Python actually executes that code. This distinction is critical. Understanding Python's execution model transforms you from a coder into a craftsman. It enables you to predict behavior in novel situations, debug complex issues with speed, and ensure your code does precisely what you intend, not what you accidentally specified.
This article is the first in a series dedicated to mastering Python through code tracing. We begin with the execution model because it forms the bedrock upon which all other Python concepts are built. Grasping this fundamental layer allows for a deeper comprehension of everything from memory management to object-oriented programming.
What Happens When Python Runs a Script
Before Python executes a single line of your script, the interpreter performs several crucial steps. This preparatory phase is often overlooked but is fundamental to understanding the execution flow.
Compilation to Bytecode
When you execute a Python file (e.g., python my_script.py), the interpreter first compiles your human-readable source code into an intermediate format known as bytecode. This bytecode is a low-level, platform-independent set of instructions that the Python Virtual Machine (PVM) can understand and execute. Think of bytecode as Python's own assembly language. It's not machine code that your CPU directly understands, but it's a more optimized and efficient representation of your source code that's easier for the PVM to process.
This compilation step is why you can often run the same Python code on different operating systems (Windows, macOS, Linux) without modification. The PVM handles the translation of bytecode into platform-specific machine instructions. The compiled bytecode is typically stored in .pyc files in a __pycache__ directory. Python checks these files first; if they are up-to-date with the source code, it skips the compilation step, leading to faster script startup times.
The Python Virtual Machine (PVM)
Once the source code is compiled into bytecode, it's handed over to the Python Virtual Machine (PVM). The PVM is the runtime engine of Python. It's responsible for interpreting the bytecode and executing the corresponding operations. The PVM is not a physical machine but a program that simulates the behavior of a computer. It manages memory, handles the call stack, and executes each bytecode instruction sequentially.
The PVM operates in a loop, often referred to as the fetch-decode-execute cycle. In each cycle, it fetches the next bytecode instruction, decodes it to understand what operation needs to be performed, and then executes that operation. This process continues until all bytecode instructions have been executed or an error occurs.
Execution Context: Frames, Scopes, and the Call Stack
Understanding how Python manages the execution of functions and the data associated with them is key to mastering the execution model. This is where concepts like frames, scopes, and the call stack come into play.
The Call Stack
The call stack is a data structure that keeps track of the active functions in a program. When a script starts, an initial frame is pushed onto the stack for the main module. When a function is called, a new frame is created for that function and pushed onto the top of the stack. This frame contains information specific to that function's execution, such as its local variables, arguments, and the return address (where to resume execution after the function finishes).
When a function returns, its frame is popped off the stack, and control is passed back to the calling function at the stored return address. If a function calls another function, a new frame is pushed on top. This LIFO (Last-In, First-Out) structure ensures that functions are executed in the correct order and that local state is properly managed. An overly deep call stack can lead to a stack overflow error, though this is less common in Python due to its dynamic nature and memory management compared to languages like C++.
Execution Frames
Each time a function is called, Python creates an execution frame (also known as a stack frame). This frame is a dedicated space in memory that holds all the information related to that specific function call. It includes:
- Local Variables: All variables defined within the function's scope.
- Global Variables: References to variables in the global scope.
- Built-in Scope: Access to Python's built-in functions and constants (like
print,len,True). - Code Object: A reference to the compiled bytecode of the function.
- Instruction Pointer: Keeps track of the next bytecode instruction to be executed.
- Return Address: Where to return control after the function completes.
The call stack is essentially a list of these execution frames. The currently executing function's frame is always at the top of the stack.
Scopes and Namespaces
Scopes define the visibility and accessibility of variables. Python follows a LEGB rule for resolving names:
- Local (L): Names defined within the current function.
- Enclosing Function Locals (E): Names in the local scope of any enclosing functions (for nested functions).
- Global (G): Names defined at the top level of the module, or explicitly declared global within a function.
- Built-in (B): Names pre-assigned in the built-in names module (e.g.,
sum,open).
When you reference a variable, Python searches for it in this order. The first place it finds the name is where it resolves it. Namespaces are dictionaries that map names to objects. Each scope has an associated namespace. For example, a function's local variables reside in its local namespace.
Code Tracing: Observing the Execution Flow
Code tracing is the process of stepping through your code line by line, observing the state of variables, the call stack, and other execution details at each step. This technique is invaluable for understanding complex logic and pinpointing errors.
Using the sys Module
Python's built-in sys module provides powerful tools for introspection and tracing. The sys.settrace() function allows you to register a callback function that will be invoked by the PVM for various events, such as line execution, function calls, and returns. This is the underlying mechanism used by debuggers.
Consider a simple example:
import sys

def trace_calls(frame, event, arg):
    if event == 'call':
        co = frame.f_code
        func_name = co.co_name
        line_no = frame.f_lineno
        print(f"Calling function {func_name} at line {line_no}")
    return trace_calls

def greet(name):
    print(f"Hello, {name}!")

def main():
    sys.settrace(trace_calls)
    greet("World")
    sys.settrace(None) # Turn off tracing

main()
When this script runs, trace_calls will be invoked for each event. The event == 'call' condition ensures we only print when a function is entered. The frame object provides access to the current execution context, including the function name (`frame.f_code.co_name`) and line number (`frame.f_lineno`).
The Role of the Instruction Pointer
Within each execution frame, an instruction pointer (or program counter) keeps track of the next bytecode instruction to be executed. As the PVM progresses through the bytecode, it updates this pointer. When a function call occurs, the instruction pointer for the caller is effectively paused, and the PVM starts executing the bytecode of the called function, advancing its own instruction pointer.
Tracing tools often hook into the PVM's event system to report when the instruction pointer moves to a new line of source code. This allows developers to visualize the exact path of execution, including jumps, loops, and conditional branches, as represented by the bytecode instructions.
Why This Matters: Practical Implications
A deep understanding of Python's execution model isn't just an academic exercise. It directly impacts your ability to write robust, efficient, and maintainable code.
Debugging
When a bug surfaces, knowing how Python manages state, scopes, and function calls allows you to ask more precise questions. Instead of guessing why a variable has an unexpected value, you can reason about which frame it resides in, whether it's being shadowed by a local variable, or if it was modified in an unexpected function call. Debuggers like pdb leverage these same tracing mechanisms to provide step-by-step execution, variable inspection, and call stack analysis.
Performance Optimization
Understanding bytecode and the PVM can help in identifying performance bottlenecks. While Python is interpreted, knowing that compilation to bytecode happens first, and that certain operations are more costly than others at the PVM level, can guide optimization efforts. For instance, repeatedly creating and destroying objects in tight loops might be a performance concern that can be addressed by reusing objects or using more efficient data structures.
Predicting Behavior
Unfamiliar libraries, complex asynchronous code, or subtle interactions between modules become much clearer when you can visualize the underlying execution flow. You can anticipate how data will move between scopes, how function calls will affect the call stack, and how exceptions will propagate up the stack.
Mastering Python's execution model is akin to a chef understanding the Maillard reaction or a carpenter knowing the properties of different woods. It moves you beyond simply following recipes to truly understanding the craft. The next article in this series will explore how this execution model applies to object-oriented programming in Python.