
The Root Cause: A Triple Threat
Running Puppeteer in production for any length of time inevitably leads to a familiar sight: resident memory usage that climbs steadily hour after hour. While tests might show a flat memory graph, production environments often reveal a different story. Eventually, a container hits its memory limit, and the dreaded OOM killer steps in. This isn't typically the result of a single bug. Instead, production Puppeteer memory leaks are almost always three distinct problems layered on top of each other.
The solution requires a multi-pronged approach: diligent code hygiene, implementing resource bounding, and critically evaluating whether running a full Chromium instance is even necessary for your task.
Hygiene: Closing Every Resource
The most common culprit is resource mismanagement. Every page and BrowserContext opened by Puppeteer must be explicitly closed. This closure must happen reliably, regardless of whether the operation completes successfully, times out, or throws an error. The safest way to ensure this is to wrap resource usage within a finally block. This guarantees that cleanup code executes on every possible code path.
Consider this pattern:
let browser;
let page;
try {
    browser = await puppeteer.launch();
    page = await browser.newPage();
    // ... do work with the page ...
    await page.goto('https://example.com');
    // ... more work ...
} catch (error) {
    // Handle errors
    console.error(error);
} finally {
    if (page) await page.close();
    if (browser) await browser.close();
}
Beyond pages and contexts, ensure that any other resources opened, such as custom request interception handlers or event listeners, are also properly detached or removed when no longer needed. Neglecting these seemingly small details can lead to subtle leaks that accumulate over time.
Bounding: Setting Limits and Timeouts
Even with perfect hygiene, complex operations can consume excessive resources or run indefinitely. This is where bounding becomes crucial. You must implement hard limits on resource consumption and execution time. For example, set explicit timeouts for navigation and other asynchronous operations. Puppeteer's page.goto() method accepts a timeout option, which is essential for preventing hangs.
Furthermore, consider setting memory limits for individual browser instances or even the entire application. While Puppeteer itself doesn't offer a direct way to limit a browser's memory, you can use containerization tools (like Docker) or process managers to enforce overall memory caps. When a process exceeds its limit, the operating system's OOM killer will terminate it, preventing it from consuming all available resources. This is a last resort, but it prevents a runaway process from destabilizing the entire system.
Finding the Leak: Profiling Your Puppeteer Instances
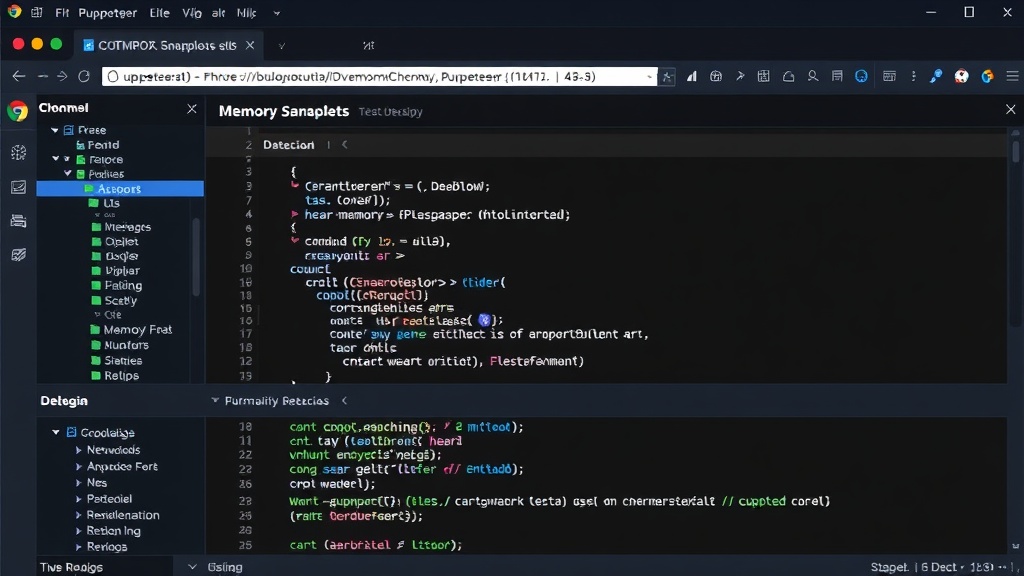
When memory usage is still climbing, it's time to profile. Node.js offers built-in profiling tools, and Chrome DevTools can connect to a running Chromium instance launched by Puppeteer. Start by launching Puppeteer with the --remote-debugging-port option. This allows you to connect Chrome DevTools to the browser instance.
Within DevTools, navigate to the Memory tab. Take heap snapshots at different points in your application's lifecycle. Compare these snapshots to identify objects that are not being garbage collected. Look for patterns: are there many detached DOM nodes? Are there large strings or arrays that should have been released? Tools like the V8 inspector and external profilers can help pinpoint the exact code paths responsible for holding onto memory.
Another common leak source is related to network interception. If you're using page.setRequestInterception(true), ensure that every intercepted request is eventually responded to or `continue()`d. Failing to do so can leave requests in a pending state, consuming memory.
The Honest Question: Do You Need Chromium?
Running a full Chromium browser instance is resource-intensive. It consumes significant CPU and RAM, and its complexity introduces more potential points of failure and memory leaks. For many common tasks, such as generating screenshots or scraping static web content, a full browser might be overkill.
Consider these alternatives:
- Dedicated Screenshot Services: Services like ScreenshotAPI, Urlbox, or BrowserStack offer APIs specifically for taking screenshots. They manage the browser infrastructure, handle scaling, and provide optimized solutions without requiring you to run and maintain Chromium yourself. This offloads the complexity and resource burden entirely.
- Headless Browsers (Non-Chromium): While less common for complex JavaScript-heavy sites, alternatives like Playwright (which supports Chromium, Firefox, and WebKit) or even simpler tools might suffice for less demanding tasks. However, if your primary goal is just screenshots, the managed service approach is often superior.
- Server-Side Rendering (SSR) or Static Site Generation (SSG): If your goal is to generate content that looks like a webpage but doesn't require dynamic client-side execution, SSR or SSG frameworks can produce HTML directly. This bypasses the need for a browser entirely.
The decision to continue running Chromium depends on your specific needs. If your application relies heavily on complex JavaScript execution, user interactions, or features unique to a full browser environment, then investing in robust leak detection and mitigation is worthwhile. However, if the core task can be accomplished with a simpler tool or an external service, migrating away from self-managed Chromium can drastically improve stability and reduce operational overhead.
Ultimately, the goal is to build reliable systems. For Puppeteer users, this means treating resource management with the utmost care, implementing proactive bounding, and honestly assessing whether the power of Chromium is truly necessary for the job at hand.