
The Single-Node Flaw in Uptime Monitoring
Every engineer on call knows the dread of an alert blaring at 3:17 AM. You stumble out of bed, pry open your laptop, and check production systems only to find everything running fine. The incident wasn't an outage; it was a transient BGP route flap, a 2-second DNS timeout, or an ISP blip hitting a single probe node in a single cloud datacenter. Yet, your uptime monitor treated it as catastrophic downtime, shattering your sleep. This common problem, alert fatigue and false alarms, led Avinash Singh to build Pingava, a multi-region synthetic monitoring platform designed to address this fundamental flaw.
Most legacy uptime monitors operate on a primitive model: a single server in one region checks your application. If that single point of contact experiences a brief, localized network hiccup, it triggers an alert. This is akin to a security guard reporting a building fire because a single window on the street level is broken, without verifying if the fire has actually spread to the interior. The result is an overwhelming number of false positives that erode trust in the monitoring system and lead to burnout for on-call engineers.
This approach fails to account for the distributed nature of modern cloud infrastructure and the internet itself. Network issues can be highly localized, affecting only a specific ISP, a particular datacenter's network segment, or even a single upstream router. A probe hitting that specific point of failure will incorrectly flag the entire service as down, regardless of whether users in other regions or on different networks can access it without issue. The cost of these false alarms extends beyond lost sleep; it includes wasted engineering hours investigating non-existent problems and a diminished ability to respond effectively when real outages occur.
The core issue is the lack of redundancy and geographical diversity in the monitoring probes themselves. If your monitoring tool relies on a single probe in, say, us-east-1, any transient issue within that region or its upstream connectivity will result in a false alarm. This is particularly problematic for global applications that serve users across multiple continents. An issue affecting a European user should not necessarily trigger an alert for an Asia-based monitoring node, and vice-versa.
Introducing Multi-Region Synthetic Monitoring
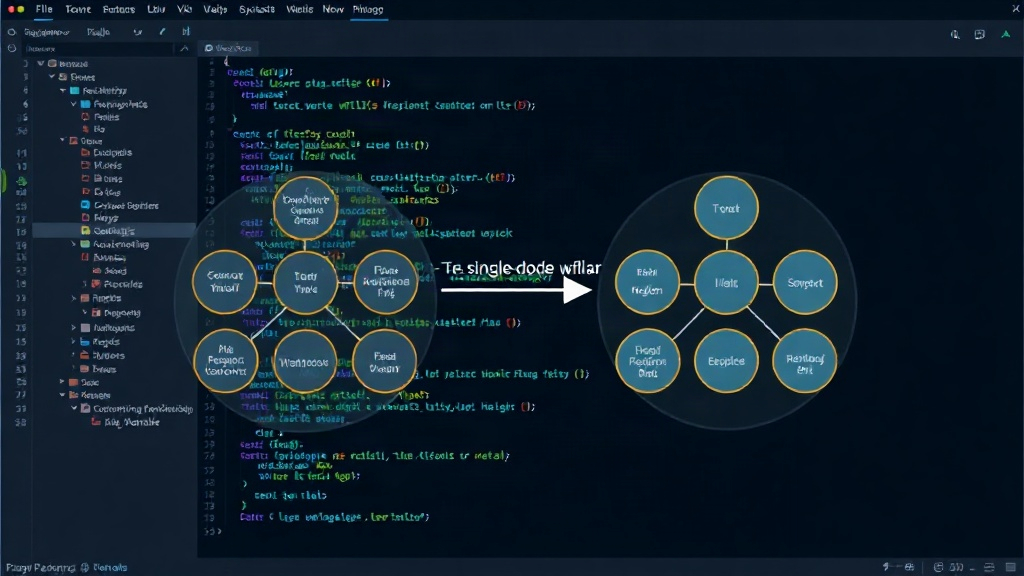
Pingava tackles this by employing a multi-region approach. Instead of relying on a single probe, it deploys monitoring nodes across diverse geographical locations and cloud providers. When a synthetic test is run, it’s executed concurrently from multiple vantage points. This allows the platform to differentiate between a genuine service-wide outage and a localized network anomaly affecting only a specific probe or region.
The system works by running checks for availability, performance, and functionality from each configured region. If the service is truly down, probes from all or most regions will report failure. However, if only one or a few probes report an issue, while others report success, Pingava can intelligently determine that the problem is likely external to the application itself – perhaps a network blip, a DNS issue, or a problem with the specific cloud provider in that area. This sophisticated correlation significantly reduces false positives.
This multi-region strategy is not just about reducing noise; it's about providing a more accurate and actionable picture of your application's health from the perspective of your actual users. By testing from locations that mirror your user base, you gain insights into how your service performs across different geographies and network conditions. This includes latency measurements, which can vary wildly depending on the user's location and their ISP.
The platform supports various types of synthetic tests, including HTTP(S) checks for basic availability, DNS checks to ensure name resolution is functioning correctly, and more complex multi-step API tests to validate critical user workflows. Each test is configured with specific thresholds for response time and success rate, which are then evaluated across all monitoring regions. Alerts are only triggered when a predefined number of regions, or a certain percentage of total regions, report failures, or when performance degrades below acceptable levels globally.
Key Features and Benefits
Pingava offers several key features designed to combat alert fatigue and provide reliable uptime monitoring:
- Multi-Region Probes: Deploys monitoring from numerous global locations across various cloud providers.
- Intelligent Alerting: Uses correlation logic to distinguish between real outages and localized network issues, drastically reducing false positives.
- Configurable Test Types: Supports HTTP(S), DNS, and custom multi-step API checks to validate critical business logic.
- Performance Monitoring: Tracks response times and latency from each region to identify performance degradation before it impacts users.
- User-Centric View: Provides insights into how the application performs from diverse geographical perspectives, mirroring user experience.
- Detailed Reporting: Offers historical data and trend analysis to understand uptime and performance patterns over time.
The primary benefit is the significant reduction in alert noise. Engineers can trust that when an alert fires, it represents a genuine problem that requires their immediate attention. This leads to better sleep, improved focus, and more efficient incident response. Furthermore, by understanding performance from multiple regions, teams can proactively identify and address issues that might only affect a subset of their user base, preventing minor problems from escalating into major outages.
For founders, this translates to improved service reliability and customer satisfaction. A monitoring system that cries wolf too often eventually gets ignored. Pingava aims to be the system that engineers can rely on, ensuring that downtime is minimized and user experience is consistently positive. The platform provides the confidence that comes from knowing your service is being monitored from the same perspectives as your users.
The Future of Uptime Monitoring
The landscape of software development and deployment is constantly evolving, with microservices, multi-cloud strategies, and edge computing becoming the norm. Traditional monitoring solutions that were designed for simpler, monolithic architectures are increasingly falling short. The problem of false alarms is not unique to one team or company; it's a systemic issue stemming from outdated monitoring paradigms.
Platforms like Pingava represent the next generation of uptime monitoring. They acknowledge the complexity of the modern internet and the distributed nature of applications. By leveraging multiple, diverse probe locations and intelligent correlation, they move beyond simply detecting a failure to accurately diagnosing its scope and origin. This shift is crucial for maintaining high availability and providing a seamless user experience in today's demanding digital environment.
What remains to be seen is how quickly the broader industry adopts these more sophisticated, multi-region approaches. Will legacy providers update their systems, or will new entrants like Pingava redefine the standard for synthetic monitoring? The pressure is on for all services to deliver near-perfect uptime, and reliable, noise-free monitoring is no longer a luxury but a necessity.