The Cost of Default Settings
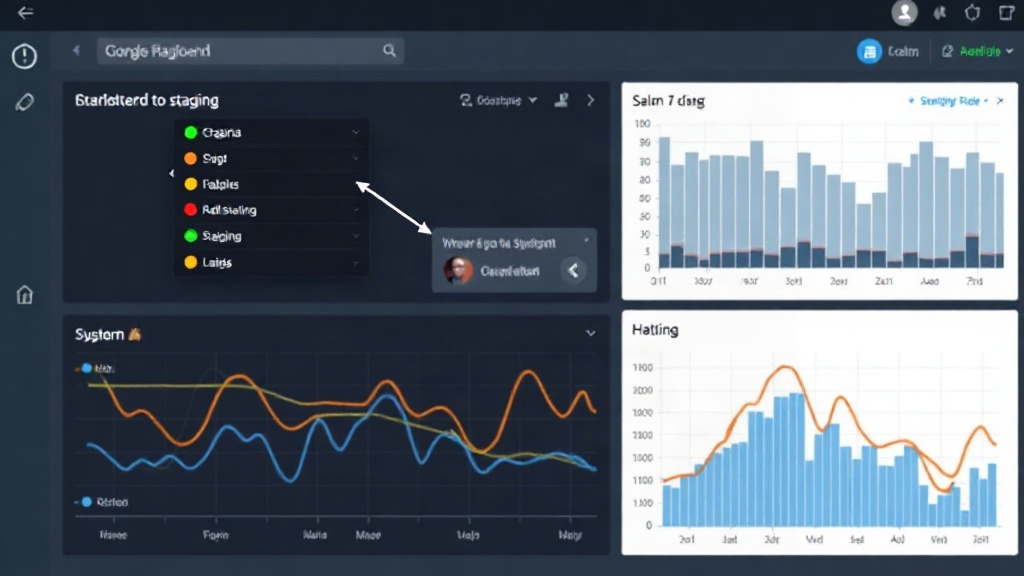
A recent outage, characterized by checkout failures affecting one in three requests, was significantly prolonged by a subtle yet critical misconfiguration in the team's monitoring tools. For the first twenty-three minutes of the incident, four engineers were staring at a dashboard that reported everything was normal. This wasn't due to a lack of data, but rather a fundamental misunderstanding of what data they were actually looking at. The dashboard, intended to provide a clear view of the production environment, was instead displaying metrics from the staging environment. The checkout service was experiencing errors, but the primary dashboard showed a flat error rate and a normal request rate, with latency hovering around 180 milliseconds. Every metric appeared accurate, current, and was reporting on a different system entirely.
The root cause? Grafana's template variables. When Grafana dashboards are configured with multiple data sources, a template variable is often used to select the environment (e.g., production, staging, development). If no specific environment is selected, the dashboard defaults to the first option in the alphabetically sorted list. In this team's setup, the 'staging' datasource happened to sort to the top. This default setting went unnoticed by most engineers because Grafana typically remembers the last selected datasource in a user's browser session. However, the incident channel's pinned link, copied two years prior, lacked this variable in its query string, forcing it to revert to the default. The engineer who opened the link that morning, unfamiliar with this specific dashboard, was none the wiser.
The Blind Spot: How Defaults Deceive
This incident is a stark reminder that seemingly innocuous default settings can have outsized impacts, especially in high-pressure situations like an outage. The engineers were operating under the assumption that their primary monitoring dashboard was correctly configured for production. The dashboard itself was functioning perfectly, displaying data – just not the right data. This created a cognitive dissonance: the real-world symptoms (checkout errors) contradicted the monitoring data. Instead of immediately questioning the monitoring data, the team spent valuable minutes trying to reconcile the discrepancy, assuming their production environment was more resilient than it was.
The problem was compounded by the fact that the Grafana link had been static for a long time. Over two years, it's likely that many engineers had interacted with the dashboard, implicitly setting their environment preference in their own browser. When a new incident occurred and the old, default-laden link was shared, it bypassed these individual settings. This highlights a common pitfall in collaborative monitoring: relying on shared links that don't explicitly define context can lead to diverging understandings of the system's state. The engineers spent twenty-three minutes analyzing a healthy staging environment while the production checkout service was failing, a direct consequence of a default setting that went unchallenged.
The Path to Resilience: Auditing Monitoring Configurations
The immediate aftermath of the incident involved consolidating Grafana dashboards. The team unified their views by implementing a single Grafana instance with a datasource template variable for each environment. This change ensures that dashboards now explicitly prompt for environment selection, eliminating the accidental default to staging. Every dashboard was updated to include this template variable, making the environment selection a conscious step rather than an implicit default.
Beyond this specific fix, the incident serves as a critical lesson for broader operational practices. It underscores the need for regular audits of monitoring configurations, particularly those involving shared dashboards or incident response links. Teams should proactively test shared links to ensure they correctly point to the intended environment or, ideally, are configured to be environment-agnostic. Furthermore, a robust incident response playbook should include a step to verify the environment being monitored. This might seem obvious, but in the heat of an outage, assumptions can easily override verification.
This situation is analogous to a firefighter arriving at a burning building but spending the first half-hour checking the water pressure at the fire station's practice hydrant because the main hose connection was accidentally set to the wrong input. The tools are there, the data is flowing, but it's not directed where it's needed most. For developers and operations teams, this means treating monitoring configurations with the same rigor as application code. Regular reviews, clear documentation, and automated checks for monitoring setup sanity are essential. The twenty-three minutes lost here represent not just time, but potential revenue, customer trust, and developer productivity. It's a high price to pay for an overlooked default.
Broader Implications for Observability
The incident raises a fundamental question about the maturity of observability practices within many organizations. While teams invest heavily in collecting metrics, logs, and traces, the presentation and interpretation of this data can become a bottleneck. The assumption that a dashboard accurately reflects the production environment is a dangerous one. This requires a shift from simply *collecting* data to actively *validating* the context and accuracy of the data presented. This means not only ensuring data sources are correct but also that the visualizations themselves are intuitive and explicitly state what they are representing.
What nobody has addressed yet is what happens when this kind of subtle misconfiguration exists in more complex, distributed systems where multiple teams manage their own monitoring dashboards. A single, easily fixable error in one team's Grafana setup can cascade into hours of wasted effort across multiple teams, each assuming their own monitoring is correct while the problem lies upstream or in a shared component. The twenty-three minutes here could easily become days in a larger, more fragmented organization. This incident, while specific to Grafana, points to a universal need for better governance and auditing of observability tools and practices. The goal must be to ensure that when an outage strikes, the eyes on the dashboard are looking at the right battlefield, not a training ground.