The Genesis: A Personal Project Becomes Open Source
What began as a personal quest to answer a specific question—whether a modern radar rendering pipeline could be built using NOAA's publicly available MRMS data—has evolved into an open-source project. David Taylor Jr. embarked on building Weather Experience, a project that unexpectedly led to the release of MRMS Renderer. This marks Taylor Creative Development's first foray into open-source contributions, demonstrating a commitment to sharing complex technical solutions.
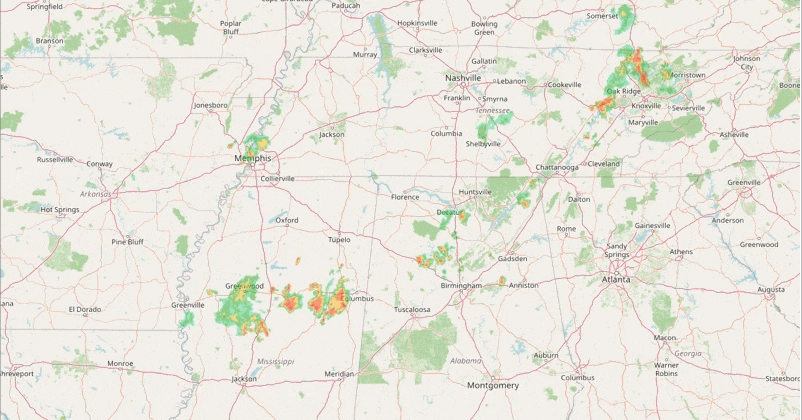
The core challenge wasn't in acquiring the vast amounts of weather data provided by NOAA's Multi-Radar/Multi-Sensor (MRMS) system. Instead, the hurdle lay in transforming this raw data into a usable and visually comprehensible format. Taylor focused on the ReflectivityAtLowestAltitude product, a key component for effective radar visualization, highlighting that the difficulty resided not in data access but in data processing and presentation.
Deconstructing the MRMS Data Pipeline
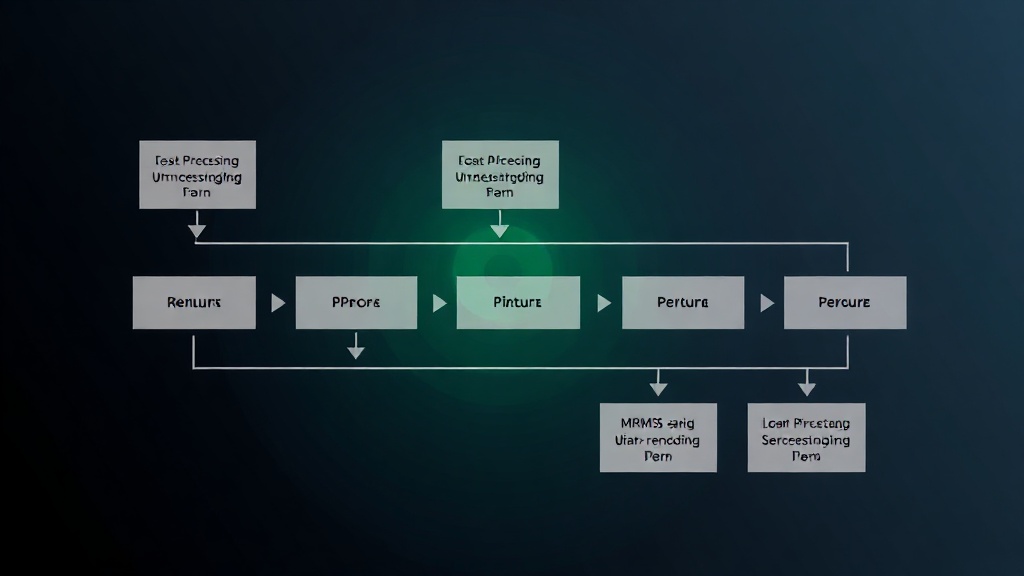
The process of rendering MRMS data involves several critical stages, each presenting unique technical challenges. At its heart, the pipeline begins with the raw data files, which are typically in the GRIB2 format. GRIB2 is a World Meteorological Organization standard for encoding weather data, known for its efficiency but also its complexity, requiring specialized libraries for decoding.
The first major step is GRIB2 Decoding. This involves parsing the binary GRIB2 files to extract the specific meteorological variables needed. For radar rendering, this primarily means extracting reflectivity data, which indicates the intensity of precipitation. This stage demands robust error handling, as GRIB2 files can vary in structure and content, and incomplete or corrupted files are not uncommon.
Following decoding, the data needs to be processed into a standardized grid. MRMS data, while comprehensive, often comes in formats that are not directly plottable on a simple Cartesian grid. This requires Data Gridding and Interpolation. Techniques are employed to ensure that the data points are uniformly distributed, allowing for consistent rendering across different geographical areas and scales. This step is crucial for avoiding visual artifacts and ensuring the accuracy of the displayed radar information.
Rendering Techniques and Performance Considerations
Once the data is decoded and gridded, the next phase is Radar Product Rendering. This is where the raw numerical data is transformed into a visual representation. For reflectivity data, this typically involves mapping intensity values to a color scale. Higher reflectivity values, indicating stronger storms or heavier precipitation, are assigned colors that convey intensity, often using a standard meteorological color palette.
The choice of rendering library and technique significantly impacts performance and visual quality. Libraries like Matplotlib, Plotly, or even more specialized graphics libraries can be used. The challenge here is to achieve real-time or near-real-time rendering, especially when dealing with rapidly updating weather data. This necessitates efficient algorithms and optimized drawing operations.
Performance Benchmarking becomes essential to ensure the renderer is practical for real-world applications. This involves measuring how quickly the renderer can process and display data, especially under heavy load or with large datasets. Factors such as CPU usage, memory consumption, and rendering frame rates are scrutinized. Optimizations might include:
- Using vectorized operations for data manipulation.
- Employing efficient color mapping techniques.
- Leveraging hardware acceleration where possible.
- Optimizing data loading and caching strategies.
The goal is to strike a balance between visual fidelity and computational efficiency, making the renderer accessible to users with varying hardware capabilities.
The Open-Source Contribution: MRMS Renderer
The MRMS Renderer project aims to provide a robust, open-source solution for developers and weather enthusiasts who need to visualize MRMS data. By releasing the project, Taylor Creative Development contributes a valuable tool to the meteorological and open-source communities.
The project's architecture is designed for modularity, allowing different components of the pipeline—from data ingestion to rendering—to be independently developed, tested, and improved. This modularity is key to its long-term viability and extensibility. Developers can integrate specific parts of the renderer into their own applications or use the entire package as a standalone tool.
The decision to open-source this project addresses a gap in readily available, modern tools for processing and visualizing complex meteorological datasets. While NOAA provides raw data and some basic tools, a flexible, Python-based renderer with a focus on performance and ease of use was a clear need.
Future Directions and Community Impact
The release of MRMS Renderer is not just about providing a tool; it's about fostering a community around open-source weather data visualization. Future development could include support for additional MRMS products beyond reflectivity, enhanced visualization options (e.g., 3D rendering, animation), and tighter integration with other meteorological data formats and analysis tools.
The project also implicitly raises questions about the standardization of weather data processing pipelines. As more complex datasets become publicly available, the need for accessible, well-documented, and performant tools like MRMS Renderer will only grow. What remains to be seen is how this project will be adopted and extended by the wider developer and meteorological communities, potentially setting new benchmarks for open-source contributions in this domain.
For developers looking to work with weather data, this project offers a practical starting point, demystifying the process of handling GRIB2 files and implementing sophisticated rendering techniques. It transforms a complex, data-intensive task into a more manageable and accessible endeavor.