
How MongoDB Aggregation Works Under the Hood
MongoDB 's aggregation framework is a powerful tool for complex data manipulation, including transformations, joins, grouping, and analytics directly within the database. However, as datasets scale into millions or billions of documents, poorly designed pipelines can lead to significant performance issues. These can manifest as excessive memory consumption, disk spills, prolonged collection-level locks, and ultimately, a degraded cluster performance. This deep-dive examines the inner workings of the aggregation engine, identifies common bottlenecks at scale, and provides concrete, actionable optimization strategies with runnable pipeline examples.
The Pipeline Execution Model
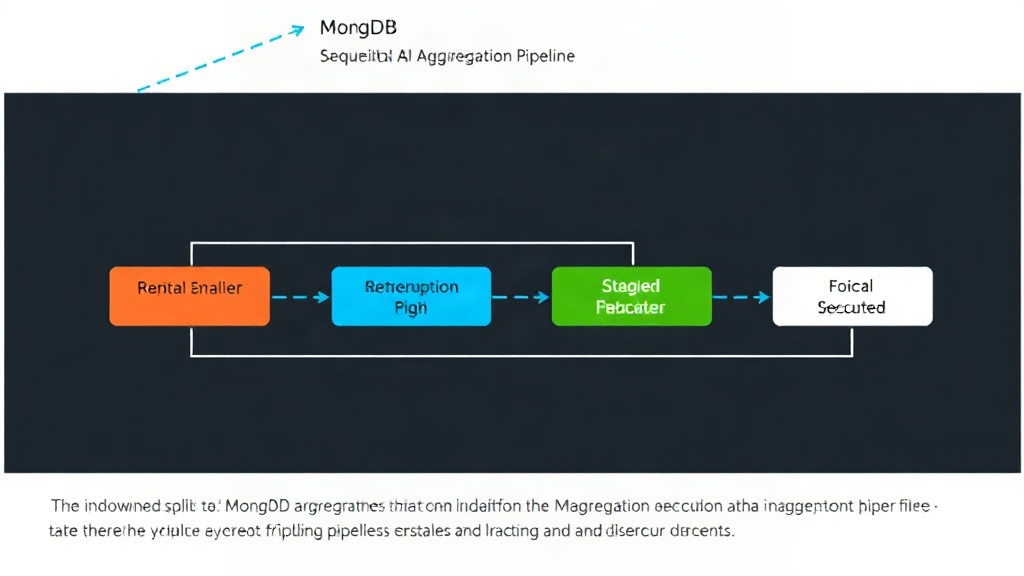
Every aggregation pipeline is a sequence of stages. MongoDB processes these stages sequentially. The engine first determines the most efficient execution plan, considering factors like available indexes, document structure, and the types of operations involved in each stage. The goal is to minimize data movement and processing. For instance, stages that can leverage indexes, such as $match and $sort when applied early and with indexed fields, are prioritized. The engine attempts to push down operations to the storage engine where possible, reducing the amount of data that needs to be materialized in memory.
However, the execution model is not always straightforward. Some stages, like $group, $sort, and $project, can be particularly resource-intensive. If the data processed by these stages exceeds available RAM, MongoDB will resort to writing intermediate results to disk, a process known as a disk spill. Disk spills dramatically slow down pipeline execution because disk I/O is orders of magnitude slower than memory access. Furthermore, certain operations can acquire collection-level locks, preventing other read and write operations on that collection while the aggregation runs. This can have a cascading negative effect on the overall application responsiveness.
Common Performance Bottlenecks at Scale
As datasets grow, several common patterns emerge that can cripple aggregation pipeline performance:
- Unfiltered Data Processing: Pipelines that do not filter documents early enough force the engine to process a massive amount of data through subsequent, potentially expensive stages. Imagine sifting through an entire library to find one specific book; it's far more efficient to use the catalog first.
- Excessive In-Memory Operations: Stages like
$groupand$sortrequire significant memory. When the intermediate data set for these stages exceeds the available RAM, MongoDB spills to disk. This is a critical performance killer. - Inefficient Joins (
$lookup): While powerful,$lookupcan be costly, especially when joining large collections or when the join condition is not selective. It essentially performs a left outer join. If the `from` collection is very large and the `localField` or `foreignField` are not indexed or the query is not selective, this stage can become a major bottleneck. - Complex Projections (
$project): Projecting many fields, especially computed fields or nested sub-documents, can increase the memory footprint and CPU usage, particularly if done before filtering. - Lack of Indexing: The absence of appropriate indexes on fields used in
$match,$sort, and$lookupstages is one of the most frequent causes of poor performance. Indexes allow MongoDB to quickly locate and retrieve relevant documents, avoiding full collection scans.
Understanding these bottlenecks is the first step toward optimization. The key is to process as little data as possible through as many stages as possible, while ensuring that the data being processed is efficiently handled.
Optimization Strategies
Optimizing aggregation pipelines involves a multi-faceted approach, focusing on reducing data volume, minimizing resource-intensive operations, and leveraging database features effectively.
1. Filter Early and Aggressively
The single most impactful optimization is to reduce the number of documents processed by the pipeline as early as possible. Use the $match stage at the very beginning of your pipeline. Ensure that the fields used in the $match stage are indexed. This allows MongoDB to use the index to quickly discard irrelevant documents before they even enter the main processing stages.
Example:
db.collection.aggregate([
  {
    $match: { status: "completed", date: { $gte: ISODate("2023-01-01") } } // Filter early using indexed fields
  },
  // ... other stages
])
If you have an index on status and date, this initial $match will significantly reduce the document count.
2. Optimize $group and $sort
These stages are often the most resource-intensive. If possible, perform sorting before grouping if the sort order aligns with the grouping key. This can sometimes allow MongoDB to optimize the grouping process. However, the primary strategy is to ensure that the data entering these stages is already minimized by earlier $match stages.
For $sort, if you need to sort a large dataset that might spill to disk, consider if the sort can be applied to a smaller subset of data after aggregation. If sorting is unavoidable on a large dataset, ensure sufficient RAM is available for your MongoDB instances and consider the hardware. If a $sort stage causes a disk spill, it's a strong indicator that the preceding stages are not filtering enough data, or the dataset is simply too large for the available resources without further optimization.
3. Efficiently Use $lookup
The $lookup stage can be a performance drain. To optimize it:
- Index Foreign Fields: Ensure that the field used in the
localFieldof the collection where the pipeline is running, and the field in the `from` collection (`foreignField`), are indexed. This speeds up the join condition matching. - Filter Before
$lookup: If possible, filter documents in the primary collection before the$lookupstage to reduce the number of lookups performed. - Use
pipelinein$lookup(MongoDB 3.6+): For more complex scenarios, you can use a sub-pipeline within$lookupto perform filtering, projection, and even grouping on the looked-up documents before they are joined. This is significantly more efficient than performing a full join and then filtering.
Example using pipeline in $lookup:
db.orders.aggregate([
  {
    $match: { orderDate: { $gte: ISODate("2023-01-01") } } // Filter orders first
  },
  {
    $lookup: {
      from: "products",
      let: { order_product_id: "$productId" },
      pipeline: [
        { $match: { $expr: { $eq: [ "$_id", "$$order_product_id" ] } } }, // Match product by ID
        { $project: { name: 1, price: 1, _id: 0 } } // Project only needed fields
      ],
      as: "productInfo"
    }
  }
])
4. Optimize $project
Only include the fields you need in your output. Avoid projecting large binary objects (like BSON types that store large amounts of data) unless absolutely necessary. If you are reshaping documents, do it as late as possible in the pipeline, after filtering and aggregation, to minimize the data being manipulated.
5. Leverage Indexes Wisely
Indexes are crucial. For aggregation pipelines, consider:
- Compound Indexes: For stages like
$matchand$sortthat use multiple fields, compound indexes can provide significant performance gains. The order of fields in the compound index matters and should align with the query predicates. - Covered Queries: If an index contains all the fields required by a stage (or the entire pipeline up to that point), MongoDB can satisfy the query using only the index, without needing to fetch documents from disk. This is extremely fast.
- Index Prefix Matching: For queries on compound indexes, ensure your query uses a prefix of the indexed fields.
6. Consider `allowDiskUse`
While not a performance optimization in itself, the allowDiskUse option in the aggregate command can prevent a pipeline from failing due to memory limits by allowing it to spill to disk. However, as noted, disk spills are a major performance bottleneck. Enabling this should be a last resort or used when you understand the performance implications and have accepted them. It's better to optimize the pipeline to avoid spills altogether.
7. Analyze Execution Plans
Use the aggregate.explain() method to understand how MongoDB is executing your pipeline. This will reveal which stages are using indexes, if disk spills are occurring, and where the pipeline is spending most of its time. Analyzing the explain output is critical for identifying specific areas for improvement.
Example:
db.collection.aggregate([
  // ... your pipeline stages
], { explain: true })
The output of explain will detail the winning plan, index usage, document counts at each stage, and importantly, indicate if disk usage is expected.
Conclusion
Optimizing large-scale MongoDB aggregation pipelines is an iterative process. It requires a deep understanding of how the aggregation framework operates, careful analysis of query execution plans, and strategic application of indexing and pipeline design principles. By filtering data early, optimizing resource-intensive stages, leveraging indexes effectively, and analyzing performance with explain, you can transform sluggish pipelines into efficient data processing engines, ensuring your MongoDB cluster performs optimally even under heavy load.