The Problem: Slow Aggregates on Massive Tables
Mattrx, a multi-tenant marketing analytics SaaS platform, faced a critical performance bottleneck. Their dashboards, crucial for user engagement, were sluggish. Specifically, a common dashboard load triggered a SUM and COUNT operation on a CampaignEvents table containing a staggering 1.2 billion rows. Each of these queries took over two seconds to complete. With 110,000 monthly active users frequently accessing these dashboards, the Azure SQL database was consistently running at 78% CPU. This performance degradation made every campaign view feel like navigating through thick mud, directly impacting user experience and operational efficiency.
The engineering team recognized that simply scaling up the database tier (e.g., a larger Azure SQL instance) was not a viable or sustainable solution. The core issue wasn't the database's capacity to store data, but the fundamental inefficiency of performing aggregate calculations directly on such an enormous dataset for every user request. The epiphany was that you don't make a billion-row aggregate fast; you engineer your system so you never have to run that aggregate in the first place.
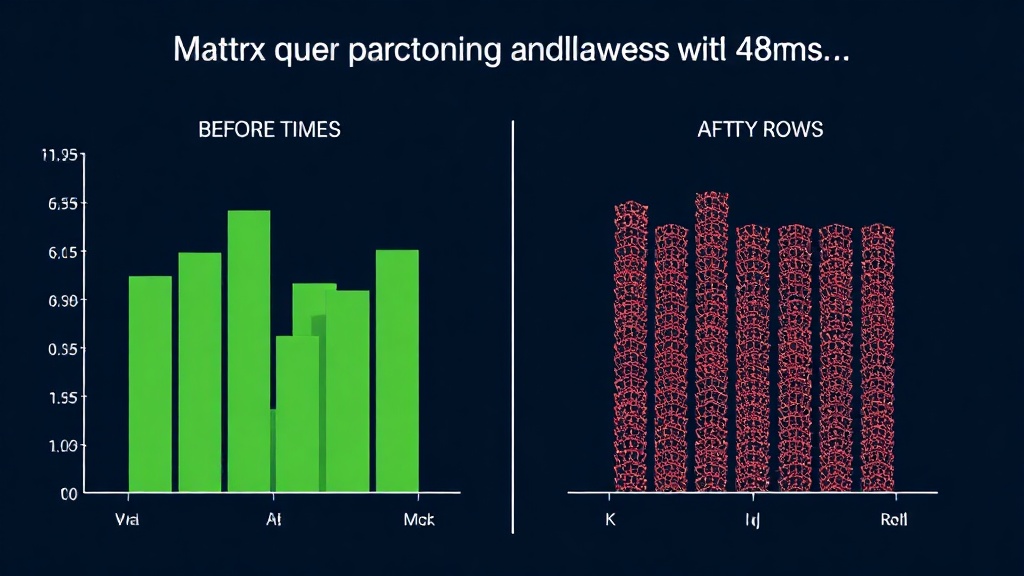
This strategic shift in architecture led to a dramatic improvement: the p95 KPI query time dropped from 2,100ms to an astonishing 48ms. This was achieved on the CampaignEvents table, which stores approximately 1.2 billion rows representing around 90 days of daily data, all while handling a peak dashboard read load of nearly 3,200 requests per second.
The Solution: Strategic Data Architecture
Mattrx's approach to solving this performance crisis involved a multi-pronged strategy focusing on data partitioning, columnstore indexing, and the implementation of read models. This wasn't about a single magic bullet but a cohesive architectural evolution.
1. Data Partitioning for Granularity
The first major step was implementing robust data partitioning. The CampaignEvents table, holding 1.2 billion rows, was partitioned daily. This means the massive table was logically divided into smaller, more manageable chunks based on the date. Instead of scanning the entire 1.2 billion rows for a query that might only need data from the last week or month, the database could intelligently target only the relevant daily partitions. This drastically reduces the amount of data the system needs to process for most queries. For a system with ~90 days of data, this is a substantial optimization, as queries targeting recent data only interact with a fraction of the total table size.
2. Columnstore Indexing for Analytical Workloads
To further accelerate analytical queries, Mattrx adopted columnstore indexing. Traditional rowstore indexes store data row by row, which is efficient for transactional workloads (inserting, updating, deleting individual rows). However, analytical queries often need to scan and aggregate data across many rows but only for a few columns. Columnstore indexes store data column by column. This format is highly efficient for aggregation operations because the database can read only the necessary columns from disk, and the data within each column is often similar, leading to excellent compression ratios. When performing operations like SUM or COUNT over specific columns, columnstore indexes provide significant read performance gains over rowstore indexes.
3. Read Models for Pre-computation and Caching
Perhaps the most critical component of Mattrx's strategy was the introduction of read models. Instead of generating aggregate metrics (like SUMs and COUNTs) on-the-fly from the massive CampaignEvents table every time a dashboard was loaded, Mattrx pre-computes these aggregates. These pre-computed results are stored in separate, optimized tables – the read models. These read models are designed specifically for fast querying. They might be structured to directly hold the aggregated KPI values, potentially using simpler data structures or even smaller, denormalized tables. This means that when a user requests dashboard data, the system queries these lean read models, which can return results almost instantaneously, rather than performing expensive calculations on the raw, multi-billion-row event table.
This strategy effectively shifts the computational burden from the user's real-time request to background processes that can run during off-peak hours or in a more controlled manner. The read models serve as a materialized view of the most frequently needed aggregate data, ensuring that the most common and performance-sensitive queries are served by data that is already aggregated and optimized for retrieval.
The Impact: A Transformed User Experience
The architectural overhaul yielded transformative results. The average query time for key performance indicators (KPIs) plummeted from over two seconds (2,100ms) to under 50 milliseconds (48ms). This represents a speedup factor of over 40x. This dramatic improvement in query performance directly translated into a vastly superior user experience for Mattrx's customers. Dashboards load almost instantly, campaign data is available without delay, and the overall application feels responsive and fluid. The reduction in database CPU load from 78% to a much healthier level also improved the stability and reliability of the entire platform, allowing for smoother operation and the ability to scale to more users without further performance degradation.
This success story highlights a fundamental principle in large-scale data analytics: optimize for the queries you *actually* run, not the raw data you store. By partitioning data, leveraging columnstore indexes for analytical workloads, and employing read models to serve pre-computed aggregates, Mattrx avoided the trap of trying to make massive, on-the-fly aggregations performant. Instead, they engineered a system where the most critical data paths are served by data structures that are inherently fast, proving that smart architecture can often outperform brute-force scaling.