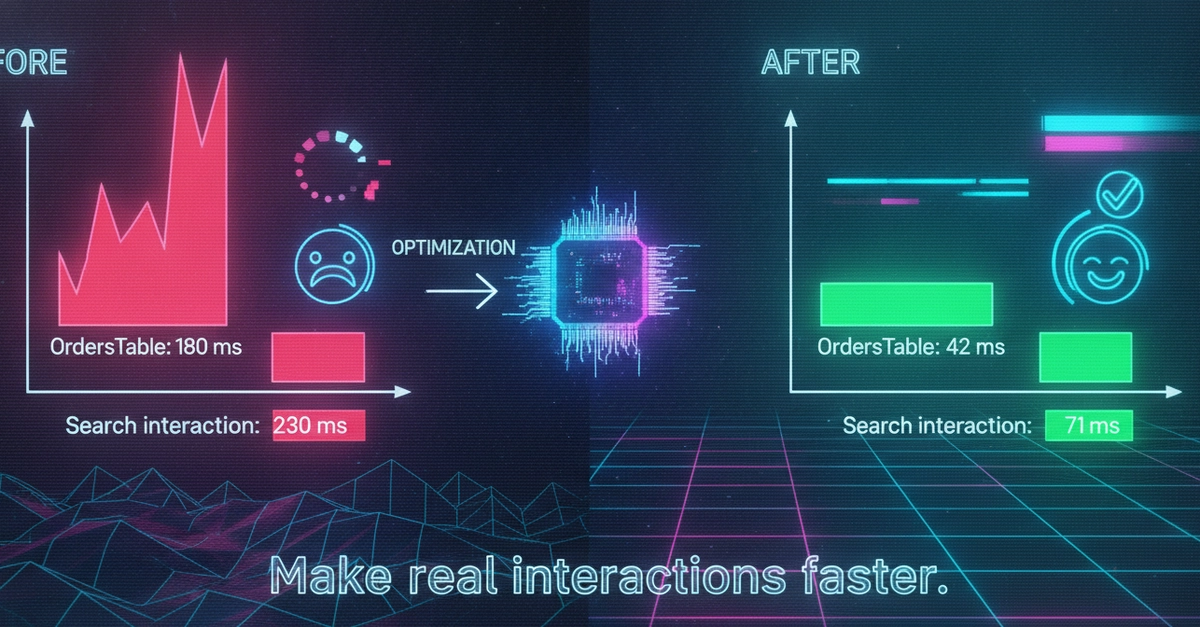
The Elusive Slowness: Why Your React App Feels Laggy
Users expect snappy interfaces. When a React application falters – be it a delayed button click, a sluggish search input, or a dashboard that takes ages to load – the user experience suffers. The real challenge isn't recognizing that slowness exists; it's pinpointing the exact component or components causing the slowdown. Guesswork is inefficient and often leads to premature optimization, addressing issues that aren't the root cause. This is where dedicated tooling becomes indispensable. The React Profiler, part of the React DevTools, offers a structured approach to diagnose these performance problems by recording user interactions and providing detailed insights into component rendering behavior.
Leveraging the React Profiler for Diagnosis
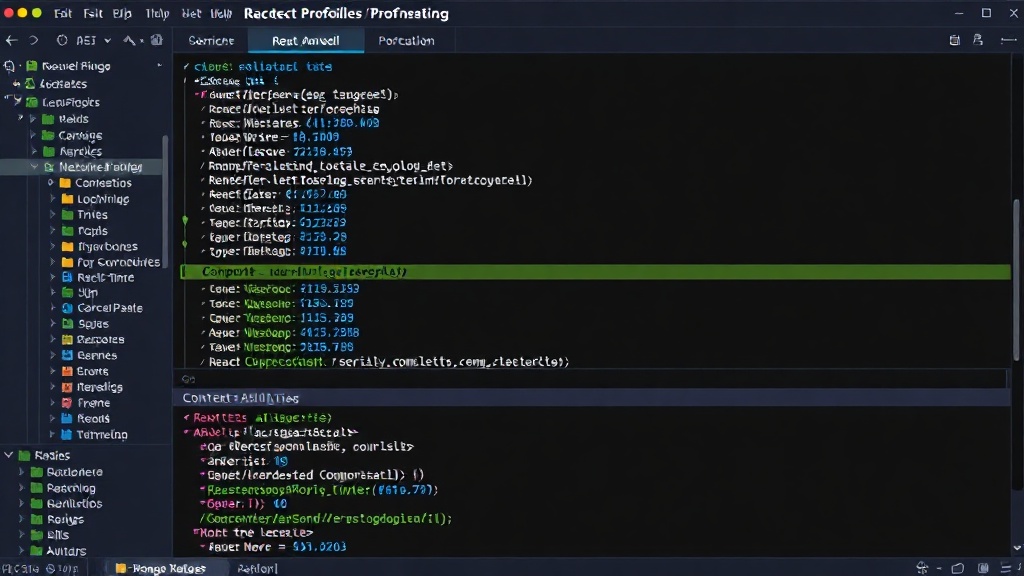
The React Profiler is your primary weapon against invisible performance drains. It allows you to record a specific interaction within your application, such as a button click or a route change. Once recorded, it presents a wealth of data, revealing precisely which components rendered, how long each rendering process took, and which components re-rendered unnecessarily. This data is crucial for moving from subjective feelings of slowness to objective, measurable performance metrics. By analyzing these recordings, developers can identify the specific culprits that are inflating render times or causing excessive re-renders.
Understanding Profiler Data: What to Look For
When you examine a profiling session, several key metrics and visual cues will help you identify problematic components:
- Render Duration: Components that consistently take a significant amount of time (hundreds of milliseconds) to render are obvious candidates for investigation. This metric shows the time spent in the render phase of a component.
- Number of Renders: A component that renders far more often than necessary can be a major performance drain. Excessive re-renders, especially for complex components or those within loops, can cascade and slow down the entire application.
- Commit Duration: This represents the time spent committing the rendered output to the DOM. While often less of a focus than render duration for individual components, long commit times can indicate issues with DOM manipulation or large updates.
- Flame Graph and Ranked Chart: The Profiler provides visual representations like the Flame Graph and Ranked Chart. The Flame Graph shows the component tree and render times, with wider bars indicating longer render durations. The Ranked Chart lists components by how often they rendered or how long they took, making it easy to spot the top offenders.
Common Causes of Slow Components
Once you've identified a slow component using the Profiler, the next step is to understand *why* it's slow. Several common patterns contribute to performance issues:
- Unnecessary Re-renders: This is perhaps the most frequent cause. Components re-render when their props or state change. If a parent component re-renders and passes down props that have changed reference (even if their values are the same), child components might re-render unnecessarily. This is particularly problematic for components that are expensive to render.
- Expensive Calculations: Performing complex computations, heavy data processing, or large data transformations directly within the render method can significantly increase render times.
- Large Lists and Data Sets: Rendering very long lists of items without optimization (like virtualization or windowing) can lead to massive DOM trees, slowing down initial render and subsequent updates.
- Deeply Nested Component Trees: While React is efficient, extremely deep component trees can increase the overhead of reconciliation and rendering.
- Inefficient State Management: Poorly structured state management can lead to frequent, broad state updates that trigger more re-renders than necessary across various parts of the application.
Strategies for Fixing Performance Problems
With the root cause identified, you can implement targeted fixes. It's crucial to avoid premature optimization; only optimize what the Profiler clearly indicates is a problem.
Optimizing Re-renders
Preventing unnecessary re-renders is key. React provides several tools:
React.memo: For functional components,React.memois a higher-order component that memoizes the component. It will only re-render if its props have changed. This is akin toPureComponentfor class components but works with functional components.useMemo: This hook memoizes the result of a computation. If the dependencies of the computation haven't changed, the memoized value is returned, avoiding redundant calculations. This is useful for expensive functions called within a component.useCallback: This hook memoizes a function instance. It's particularly useful when passing callback functions down to child components that are optimized withReact.memo. If the function reference doesn't change, the child component won't re-render due to the callback prop.- Key Prop for Lists: Ensure that lists of elements have stable, unique `key` props. This allows React to efficiently identify which items have changed, been added, or been removed, rather than re-rendering the entire list.
Optimizing Expensive Operations
For calculations that are genuinely expensive:
- Move Calculations Outside Render: If a calculation doesn't depend on props or state that change frequently, consider performing it once during component initialization or outside the component if possible.
- Debouncing and Throttling: For event handlers that might fire rapidly (e.g., window resize, input typing), debouncing or throttling can limit how often the associated logic runs.
- Web Workers: For truly heavy, non-UI-blocking computations, offload the work to Web Workers to keep the main thread free for rendering and user interactions.
Handling Large Lists
Rendering thousands of items directly is a performance killer. Techniques like:
- Virtualization/Windowing: Libraries like `react-window` or `react-virtualized` render only the items currently visible in the viewport, dramatically reducing the number of DOM nodes and improving performance.
The Pitfall of Premature Optimization
It's vital to reiterate the danger of premature optimization. Trying to optimize every component or applying memoization everywhere without data can lead to code that is harder to read, maintain, and debug, without yielding significant performance gains. The React Profiler provides the data to guide your optimization efforts. If a component isn't showing up as a bottleneck in the profiler, resist the urge to