
The Manual Triage Ritual
For many engineers, pipeline latency alerts trigger a familiar, almost ritualistic response: firing off a series of `curl` commands to Logstash's management port, typically 9600. Commands like curl -s localhost:9600/_node/stats?pretty, curl -s localhost:9600/_cat/pipelines, and curl -s localhost:9600/_plugins become the go-to tools for initial investigation. This approach is reactive and inherently manual. You parse JSON output, manually correlate JVM heap usage spikes with event flow increases, and identify thread locks yourself. It’s effective for basic checks but scales poorly and requires significant human effort for nuanced analysis.
The limitations are clear: this method is solo, time-consuming, and prone to human error. When alerts hit, the priority is speed and accuracy. Relying on a sequence of manual commands introduces latency not just in the pipeline, but in the diagnostic process itself. It's a bottleneck in the operational workflow, directly counteracting the goal of maintaining low pipeline latency.
Introducing the Model Context Protocol (MCP)
The Model Context Protocol (MCP) offers a paradigm shift away from this manual, reactive triage. Instead of a human performing repetitive checks, MCP enables intelligent agents to interact directly with Logstash's internal state. By connecting MCP-compatible agents, such as those powered by Cursor or Claude, to Logstash via a specialized API server, the diagnostic process becomes automated and context-aware. This isn't merely a convenience upgrade; it represents an architectural evolution in how we monitor and manage complex data pipelines.
MCP allows these agents to understand the 'context' of the Logstash node and its pipelines. They can ingest metrics, plugin states, and JVM details, not as raw data to be manually interpreted, but as structured information that the AI can process and reason about. This enables the agent to perform complex correlations automatically. For instance, an MCP agent can natively link a spike in incoming events to a specific plugin experiencing high resource utilization or a thread contention issue, without human intervention.
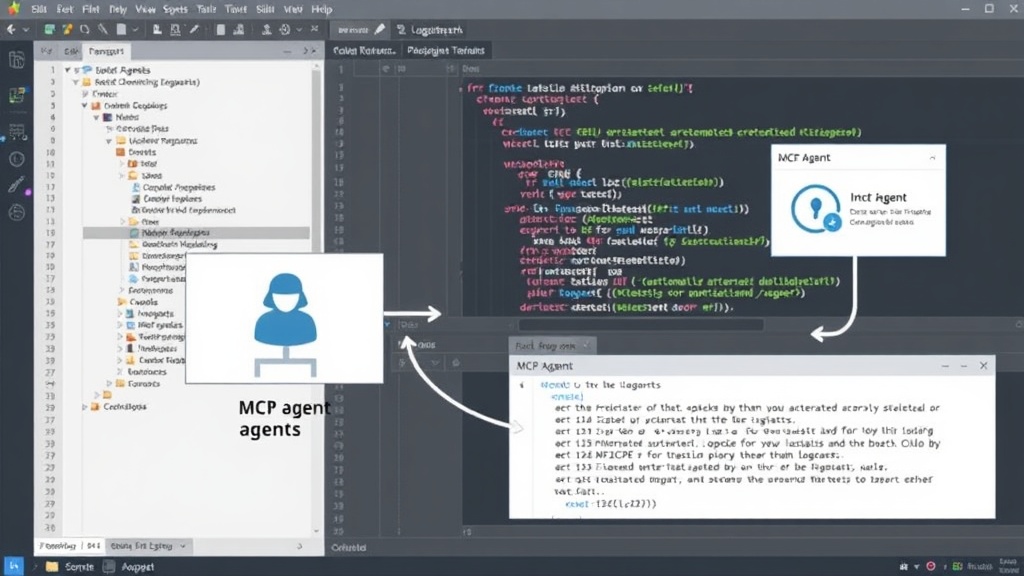
Architectural Shift: From Reactive to Proactive
The core difference lies in the shift from a reactive, human-driven inspection to a more proactive, AI-assisted analysis. Manual `curl` commands are like a doctor manually taking a patient's temperature and listening to their heart. MCP, used with intelligent agents, is like a diagnostic AI that can simultaneously monitor vital signs, analyze medical history, and suggest potential diagnoses based on a vast knowledge base.
This architectural change addresses several key pain points:
- Speed: Automated correlation of metrics and states significantly reduces the time from alert to diagnosis.
- Accuracy: AI agents can process more data points and identify subtle patterns that a human might miss, especially under pressure.
- Scalability: As Logstash deployments grow, the manual triage process becomes unmanageable. MCP scales by allowing agents to monitor multiple nodes concurrently.
- Actionability: By providing a more comprehensive and correlated view of the problem, MCP-driven analysis can lead to more precise and effective remediation steps.
Implementing MCP with Logstash
Integrating MCP with Logstash typically involves exposing a specific API endpoint on the Logstash instance that MCP-compatible agents can query. This API server translates MCP requests into Logstash internal queries, retrieves the relevant data (node stats, pipeline configurations, plugin statuses, JVM metrics, etc.), and formats it for the MCP agent. The agent then processes this data, applying its reasoning capabilities to identify potential bottlenecks.
For developers and operations teams, this means retraining their reflexes. Instead of reaching for the terminal to `curl` port 9600, the new reflex is to engage with the MCP-enabled diagnostic tool or agent. This requires setting up the MCP API server for Logstash and ensuring that the chosen AI agent is configured to communicate with it effectively. The initial setup might involve some configuration overhead, but the long-term benefits in reduced mean time to resolution (MTTR) and improved pipeline stability are substantial.
The Future of Pipeline Triage
The move to MCP for Logstash diagnostics represents a broader trend in AIOps and intelligent observability. As systems become more complex, manual monitoring and debugging become increasingly untenable. Tools and protocols that enable AI to understand and interact with system internals are crucial for maintaining performance and reliability.
The question for engineers is not *if* they will adopt more automated, AI-driven diagnostic approaches, but *when*. Those who start experimenting with MCP and similar protocols now will be better positioned to manage the inherent complexity of modern data pipelines. The ritual of manual `curl` commands is a relic of a less demanding operational era. MCP offers a path to more intelligent, efficient, and effective pipeline management.