
The Problem: Hallucinations and Bad Data
A user reports a hallucinated answer in production. The AI agent confidently stated a refund window was 90 days, when the actual policy is 30. This isn't a creative slip-up by the model; it's a symptom of deeper issues. In the world of Large Language Models (LLMs) and retrieval-augmented generation (RAG), a wrong answer almost always stems from a bad chunk of retrieved data, a stale document, a tool that returned incorrect information, or a prompt that was assembled incorrectly. The user's ticket provides a request ID, but nothing else. Without a robust tracing system, diagnosing the root cause of this specific failure is impossible. You cannot see the internal workings of the LLM's decision-making process from its output alone.
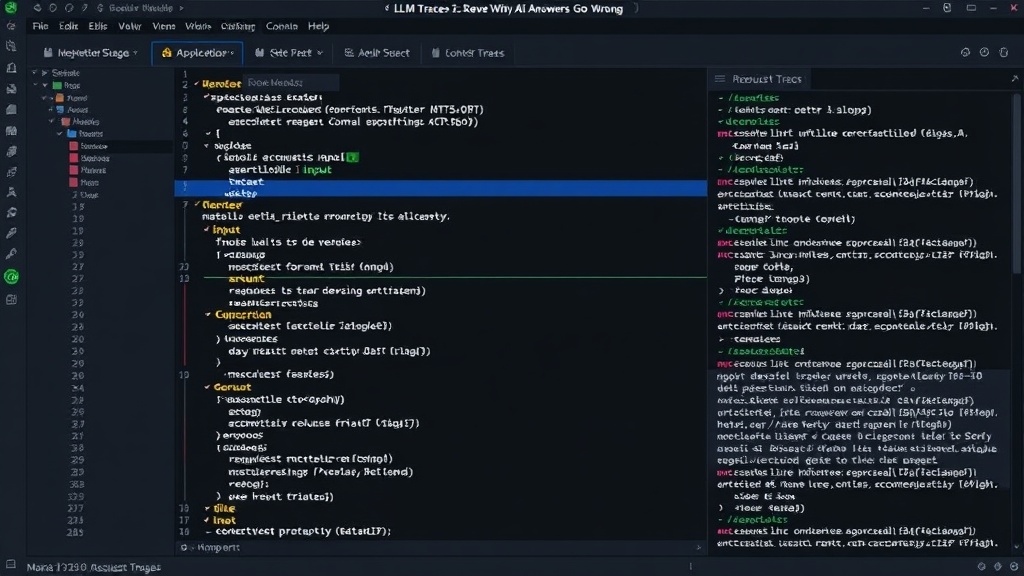
To understand what went wrong with that single request, you need the full trace. This trace is a detailed log of the entire request lifecycle. It shows which specific chunks of information retrieval pulled, the exact prompt the model received after templating, and the precise output from each tool call made during the generation process. The speed at which you can access and analyze this trace is entirely dependent on the tracing infrastructure you implemented months earlier. This highlights a critical dependency: effective debugging of LLM applications hinges on proactive and comprehensive tracing.
The Solution: Comprehensive Tracing
Tracing for LLM applications is not a luxury; it's a necessity. It provides the granular visibility required to debug complex AI systems. Think of it less like a simple error log and more like a detective's detailed case file for every single request. This case file reconstructs the entire journey of a user's query, from the initial input to the final output. Key components of a useful trace include:
- Prompt Engineering & Templating: The exact prompt sent to the LLM after all variables, context, and system instructions have been applied. This is crucial because subtle changes in prompt structure can lead to vastly different outputs.
- Retrieval Augmented Generation (RAG) Details: Which documents or data chunks were retrieved, their source (e.g., database, knowledge base), and their relevance score. This helps identify if the LLM was fed outdated or incorrect information.
- Tool Calls: If the LLM interacted with external tools (APIs, databases, search engines), the trace must log the tool called, the arguments passed, and the exact response received. This is vital for pinpointing issues where an external service provided bad data.
- Model Output: The raw output from the LLM before any post-processing or formatting.
- Latency and Performance: Timestamps for each stage of the process, allowing for performance bottleneck identification.
Without these details, debugging becomes a guessing game. Developers are left staring at the final output, unable to backtrack and pinpoint the exact failure point. Was it the retrieval mechanism that pulled the wrong document? Was the prompt template malformed? Did an external API return an unexpected error or stale data? The trace answers these questions definitively.
Tools for Effective Tracing
Several open-source and commercial tools are emerging to address the critical need for LLM observability. These platforms go beyond traditional application performance monitoring (APM) to offer specialized features for AI applications.
LangChain and LlamaIndex Integrations
Frameworks like LangChain and LlamaIndex, which are popular for building LLM applications, are increasingly integrating with tracing backends. For instance, LangChain offers direct integration with tools like:
- LangSmith: Developed by the creators of LangChain, LangSmith provides a dedicated platform for debugging, testing, and monitoring LLM applications. It visualizes chains, traces individual LLM calls, and helps identify problematic prompts or retrieved contexts. It's designed to give developers deep visibility into their LangChain applications.
- OpenTelemetry: A vendor-neutral, open-standard for telemetry data (metrics, logs, traces). Many APM tools and tracing backends support OpenTelemetry, making it a versatile choice for instrumenting LLM applications. Developers can use OpenTelemetry SDKs to instrument their code, sending trace data to compatible backends like Jaeger, Zipkin, or commercial APM solutions.
LlamaIndex, focused on data connection for LLMs, also provides mechanisms to log and inspect retrieval processes, which are fundamental to RAG applications. By logging the queries made to data indexes and the results returned, developers can debug the data retrieval aspect of their LLM pipeline.
Specialized Observability Platforms
Beyond framework-specific integrations, a growing number of platforms are dedicated to LLM observability:
- Arize AI: Offers a comprehensive platform for ML observability, including specific features for LLMs. It helps monitor performance, detect drift, and debug issues by analyzing model inputs, outputs, and embeddings.
- Weights & Biases (W&B): Primarily known for experiment tracking in machine learning, W&B also provides tools for LLM tracing and debugging, allowing users to log prompts, responses, and intermediate steps of LLM interactions.
- Honeycomb: A popular observability platform that, while not exclusively for LLMs, can be effectively used to trace complex distributed systems, including those powered by LLMs, by leveraging OpenTelemetry or custom instrumentation.
The common thread among these tools is the emphasis on understanding the 'why' behind an LLM's output. They provide the necessary scaffolding to move from a user-reported problem to a root cause analysis in minutes, not days.
The Future of LLM Debugging
As LLM applications become more sophisticated and integrated into critical business processes, the need for reliable debugging and observability will only intensify. The ability to quickly identify and rectify errors is paramount for maintaining user trust and operational integrity. Investing in a robust tracing strategy is no longer optional; it's a foundational requirement for building and deploying production-ready LLM systems.
The surprising detail here is not the emergence of these tools, but the stark realization of how quickly the development lifecycle for AI applications has outpaced traditional debugging paradigms. What nobody has addressed yet is what happens to the thousands of developers who built on older, less observable LLM architectures, and how they will retroactively implement tracing without significant refactoring.