What is Linear Regression?
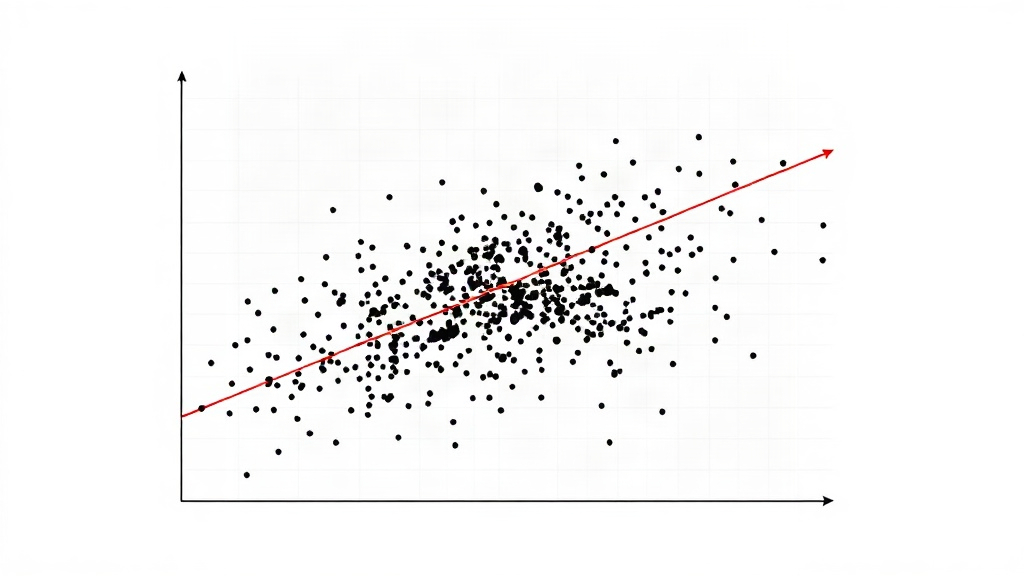
Linear regression is a fundamental statistical method used to model the relationship between a dependent variable and one or more independent variables. At its heart, it seeks to find the best-fitting straight line that describes the trend within a given set of data points. This line represents the linear association between the variables, allowing us to understand how changes in the independent variable(s) correlate with changes in the dependent variable.
The primary goals of employing linear regression are multifaceted. Firstly, it serves as a powerful tool for prediction. By establishing a relationship, we can input new values for the independent variable(s) and forecast the likely outcome for the dependent variable. Secondly, it aids in understanding the nature of these relationships. It quantifies how strong the association is and in which direction it points – positive or negative. This inferential capability is crucial for drawing meaningful conclusions from data.
Types of Linear Regression
Linear regression is broadly categorized into two main types, distinguished by the number of independent variables involved:
Simple Linear Regression
This is the most basic form, involving only one independent variable (often denoted as 'X') to predict a single dependent variable (often denoted as 'Y'). The goal is to find the line that best explains the variation in Y based on X. For instance, one might use simple linear regression to model the relationship between the number of hours studied (independent variable) and the exam score obtained (dependent variable).
Multiple Linear Regression
In contrast, multiple linear regression utilizes two or more independent variables to predict a single dependent variable. This allows for a more complex and often more realistic modeling of phenomena where multiple factors influence an outcome. For example, predicting house prices (dependent variable) could involve independent variables such as square footage, number of bedrooms, and proximity to amenities.
The Linear Regression Equation
The mathematical foundation of linear regression is its equation, which defines the line of best fit. For a simple linear regression, the equation is:
Y = β₀ + β₁X + ε
Let's break down the components:
- Y (Dependent Variable): This is the variable we are trying to predict or explain. It's the outcome we are interested in.
- X (Independent Variable): This is the variable used to predict Y. In multiple linear regression, there would be X₁, X₂, ..., Xn.
- β₀ (Intercept): This is the value of Y when X is zero. It represents the point where the regression line crosses the Y-axis.
- β₁ (Coefficient/Slope): This indicates the change in Y for a one-unit change in X. It quantifies the strength and direction of the linear relationship. For multiple linear regression, there would be β₁, β₂, ..., βn, each corresponding to an independent variable.
- ε (Error Term): This represents the random error or unexplained variance in Y that is not captured by the independent variable(s). It accounts for all other factors that might influence Y but are not included in the model.
How Linear Regression Works
The core task in linear regression is to estimate the values of β₀ and β₁ (and subsequent coefficients in multiple regression) that minimize the difference between the observed values of Y and the values predicted by the regression line. This difference is often referred to as the residual.
The most common method for achieving this is the Ordinary Least Squares (OLS) method. OLS works by finding the coefficients that minimize the sum of the squared residuals. Squaring the residuals ensures that positive and negative errors do not cancel each other out and gives more weight to larger errors.
Assumptions of Linear Regression
For the results of linear regression to be reliable and interpretable, several assumptions must be met:
- Linearity: The relationship between the independent and dependent variables is linear.
- Independence: The observations are independent of each other.
- Homoscedasticity: The variance of the error term is constant across all levels of the independent variable(s).
- Normality: The error terms are normally distributed.
Violations of these assumptions can affect the validity of the model's predictions and inferences. Diagnostic plots are often used to check these assumptions.
Applications of Linear Regression
Linear regression is a versatile technique with applications across numerous fields:
- Economics: Predicting stock prices, analyzing the impact of economic policies, forecasting GDP.
- Finance: Risk assessment, portfolio management, predicting asset returns.
- Marketing: Understanding customer behavior, predicting sales based on advertising spend.
- Healthcare: Analyzing patient data to predict disease progression or treatment effectiveness.
- Social Sciences: Studying relationships between demographic factors and social outcomes.
The ability to predict continuous values, understand the strength of relationships, and make inferences makes linear regression an indispensable tool in the data scientist's toolkit.