The Need for Visibility in LLM Production
Building a functional RAG (Retrieval-Augmented Generation) system or AI agent is one thing; ensuring it performs reliably in production is another. The transition from a working prototype to a production-ready system introduces a host of operational challenges. While previous guides focused on building these systems, this article delves into the critical aspects of making them production-grade, starting with observability.
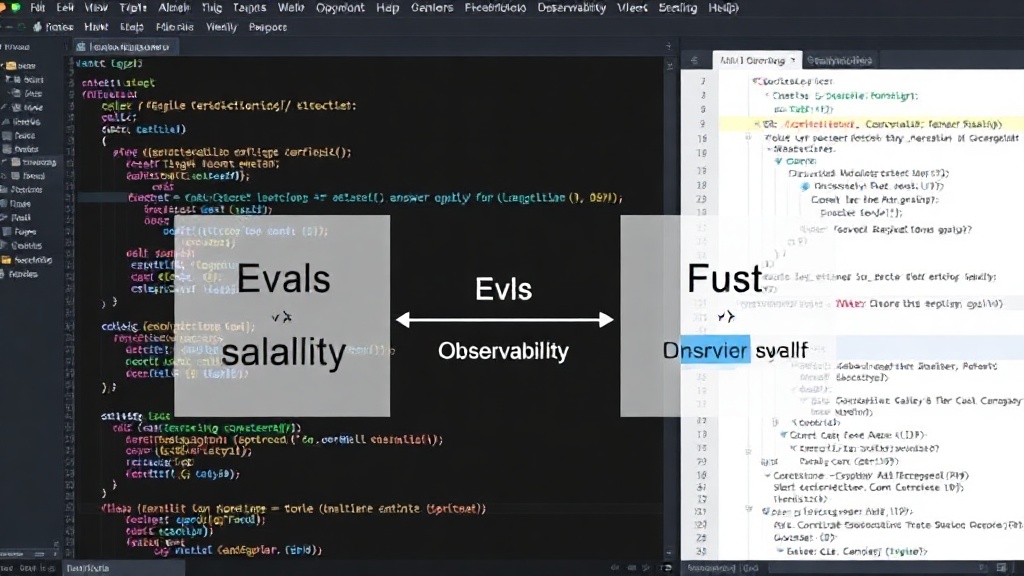
Observability is about making the internal state of a system visible through external outputs. For RAG and agent systems, this means understanding not just the final output but the entire process: which tools were invoked, how many times, and the duration of each step. This contrasts with 'Evals,' which focus on measuring the quality of the final answer, such as correctness. Observability, on the other hand, visualizes the system's behavior.
Langfuse v4, an open-source observability tool, is central to this endeavor. It offers both a free cloud tier and a self-hostable option, making advanced tracing accessible. It's important to note that Langfuse v4, released in March 2026, introduced significant API changes, deprecating functions like langfuse_context, update_current_observation, and update_current_trace. This tutorial specifically targets versions 4.9 and later, ensuring compatibility with the latest features.
Tracing RAG Systems with Langfuse v4
Langfuse v4 provides the tools to trace the execution flow of RAG pipelines. This allows developers to pinpoint bottlenecks, debug unexpected behavior, and understand resource consumption. For a RAG system, this typically involves tracing the retrieval step, the prompt construction, the LLM call, and any post-processing. Each of these stages can be logged and visualized, creating a detailed timeline of the request.
Consider a typical RAG query. Langfuse can capture:
- The initial user query.
- The retrieved documents, including their source and relevance scores.
- The prompt sent to the LLM, with placeholders for retrieved context.
- The LLM's response, including latency and token usage.
- Any subsequent processing steps, such as answer generation or formatting.
This granular tracing is essential for identifying where the system might be failing to retrieve relevant documents, generating suboptimal prompts, or experiencing high latency from the LLM provider.
Observing AI Agents with Langfuse v4
The complexity of AI agents, which often involve multiple steps, tool calls, and decision-making processes, makes observability even more critical. Langfuse v4 enables developers to visualize the agent's thought process, including which tools were selected, the arguments passed to them, and the results returned. This is akin to looking over the shoulder of the AI as it works.
For an agent, Langfuse can trace:
- The initial user instruction.
- The agent's internal reasoning steps (e.g., planning, tool selection).
- Each tool invocation: the tool name, input parameters, and the output received.
- LLM calls made by the agent for reasoning or tool execution.
- The final response generated by the agent.
This level of detail is invaluable for debugging agent logic. If an agent fails to achieve its objective, tracing reveals whether it chose the wrong tool, provided incorrect arguments, or misinterpreted the tool's output. This systematic approach moves beyond simply seeing a failed outcome to understanding the precise failure point in the agent's execution graph.
The Observability-Production Link
The challenges of production operations for LLM-based systems are manifold. They range from ensuring consistent answer quality and managing escalating costs to maintaining security and implementing robust MLOps practices. Observability is the foundational layer that underpins the ability to address these challenges effectively.
Without deep visibility into system behavior, it's nearly impossible to:
- Diagnose production issues: When a user reports an error or poor performance, tracing allows engineers to quickly identify the root cause within the complex RAG or agent pipeline.
- Optimize performance: Identifying slow-running components or frequently failed tool calls enables targeted optimizations.
- Monitor costs: Understanding LLM token usage and tool execution frequency per request helps in managing operational expenses.
- Ensure reliability: By visualizing execution paths, developers can identify edge cases or failure modes that might not have been apparent during development.
Langfuse v4's ability to provide this detailed, structured view of RAG and agent operations is a critical step in bridging the gap between building and deploying these advanced AI systems successfully.
Beyond Observability: The Production Stack
While observability is crucial, it's just one piece of the production puzzle. This guide series aims to cover a broader spectrum of production considerations. Following observability, the next steps involve rigorous Evals for automated quality measurement, robust Security measures to protect against vulnerabilities and misuse, comprehensive MLOps for streamlined deployment and management, and advanced techniques like Fine-tuning, Multi-Agent coordination, and Governance.
Each of these areas builds upon the foundation laid by observability, providing the necessary tools and methodologies to move from a functional AI system to a reliable, secure, and scalable production service.