Understanding VPA's Data Requirements
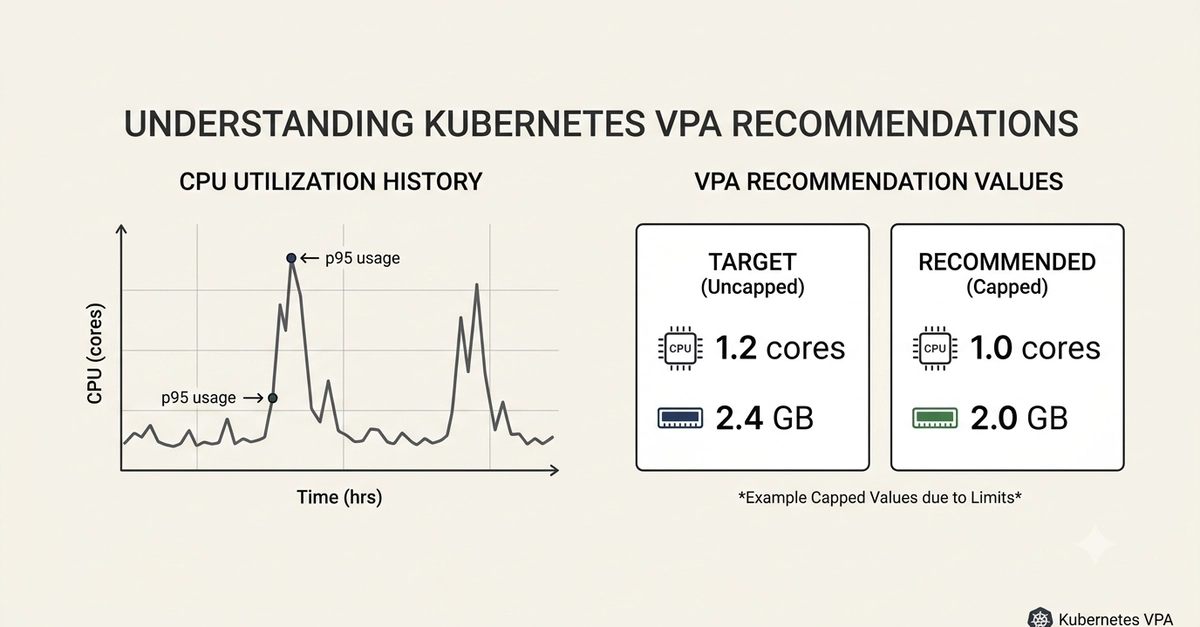
The Vertical Pod Autoscaler (VPA) is a powerful Kubernetes tool that automatically adjusts the resource requests and limits for your pods. However, its effectiveness hinges on accurate, real-world usage data. While the underlying math of VPA's decay-weighted percentile calculations and Out-Of-Memory (OOM) bumps are covered in companion posts, this article focuses on the practical side: how to extract the necessary metrics directly from a live Kubernetes cluster. This is about getting your hands dirty with the commands that feed the VPA model.
Every command discussed here functions identically whether you are using plain Kubernetes with kubectl or OpenShift with oc. The oc command is a superset of kubectl, meaning any kubectl command can be replaced with oc for the same result, with a few OpenShift-specific additions noted where applicable.
Extracting CPU Usage Metrics
VPA primarily relies on historical CPU and memory usage samples to make its recommendations. To get this data, you'll typically query the Kubernetes Metrics Server. The fundamental command for retrieving CPU usage for a specific pod is:
kubectl top pod <pod-name> -n <namespace> --containersThis command provides a snapshot of the current CPU usage for each container within a given pod in a specified namespace. While this gives you the *current* state, VPA is designed to look at historical trends. The Metrics Server collects this data over time, and VPA's recommender component processes it. For VPA to function optimally, the cluster must have the Metrics Server deployed and properly configured, and the VPA controller must be running and configured to observe the relevant pods.
The output of kubectl top pod is straightforward, showing CPU in millicores (m). For example:
NAME                                CPU(cores)   MEMORY(bytes)
my-app-pod-12345-abcde              50m          128Mi
my-app-pod-12345-abcde-init-container 10m          32Mi
This output is valuable for immediate troubleshooting and understanding current resource consumption, but VPA goes deeper by analyzing a window of historical data. The specific window and how older data points decay in influence are part of VPA's algorithmic tuning, detailed elsewhere.
Gathering Memory Usage Data
Memory usage is equally critical for VPA. The command to retrieve memory usage is very similar to the CPU command, with the key difference being the metric being reported:
kubectl top pod <pod-name> -n <namespace> --containers --memoryThis command will output the current memory usage for each container in the pod, typically displayed in Mebibytes (Mi).
NAME                                CPU(cores)   MEMORY(bytes)
my-app-pod-12345-abcde              50m          128Mi
my-app-pod-12345-abcde-init-container 10m          32Mi
Again, this provides the current usage. VPA leverages the historical data collected by the Metrics Server. The --memory flag is essential here to ensure you are looking at memory consumption rather than just CPU.
The Tricky Part: Historical Usage Samples
The most challenging aspect of feeding VPA accurate data lies in accessing and interpreting the historical usage samples. VPA doesn't just look at the last minute; it analyzes a configurable window of past performance. The Kubernetes Metrics Server is the source for this historical data. It aggregates metrics from the Kubelet on each node, which in turn collects them from cAdvisor.
VPA controller queries the Metrics Server API to fetch these historical data points. The exact mechanism involves the VPA controller making requests to the Metrics Server for metrics like container_cpu_usage_seconds_total and container_memory_working_set_bytes over a specified time range. This time range is configurable within the VPA controller's deployment, often defaulting to a period that captures typical workload behavior.
If you are troubleshooting VPA recommendations or want to understand the data it's using, you might need to interact with the Metrics Server more directly. However, for most users, ensuring the Metrics Server is running and VPA is configured to observe their pods is sufficient. The VPA controller abstracts away the direct querying of historical raw data for end-users.
The