
Understanding Benford's Law
Benford's Law, a mathematical observation, states that in many real-world sets of numerical data, the leading digit is approximately distributed according to a logarithmic function. Specifically, the digit 1 appears as the leading digit about 30% of the time, while larger digits appear less frequently. This phenomenon, first described by Simon Newcomb in 1881 and later popularized by physicist Frank Benford in 1938, applies to data sets that span several orders of magnitude. Examples include financial statements, river lengths, population numbers, and physical constants.
The law is not intuitive. We might expect leading digits to be uniformly distributed, with each digit from 1 to 9 appearing roughly 11% of the time. However, the logarithmic progression of Benford's Law arises from the way numbers grow and scale. Consider a set of numbers starting with 1. They must grow by nearly 90% (to reach 2) before the leading digit changes. In contrast, numbers starting with 9 only need to grow by about 11% (to reach 10) before the leading digit changes to 1. This naturally leads to a higher frequency of smaller leading digits.
Deviations from Benford's Law can signal that a dataset is not naturally occurring or has been manipulated. This makes it a powerful tool for fraud detection, data integrity checks, and anomaly detection in various fields, from accounting and tax audits to scientific research and election analysis.
Introducing the Interactive Explorer
A new interactive tool, developed by Vatsal Bakshi, allows users to explore Benford's Law against their own datasets. The explorer provides a visual and analytical approach to understanding how a given data set conforms to or deviates from the expected distribution. This is particularly useful for data scientists, forensic accountants, and anyone needing to validate the authenticity or naturalness of numerical data.
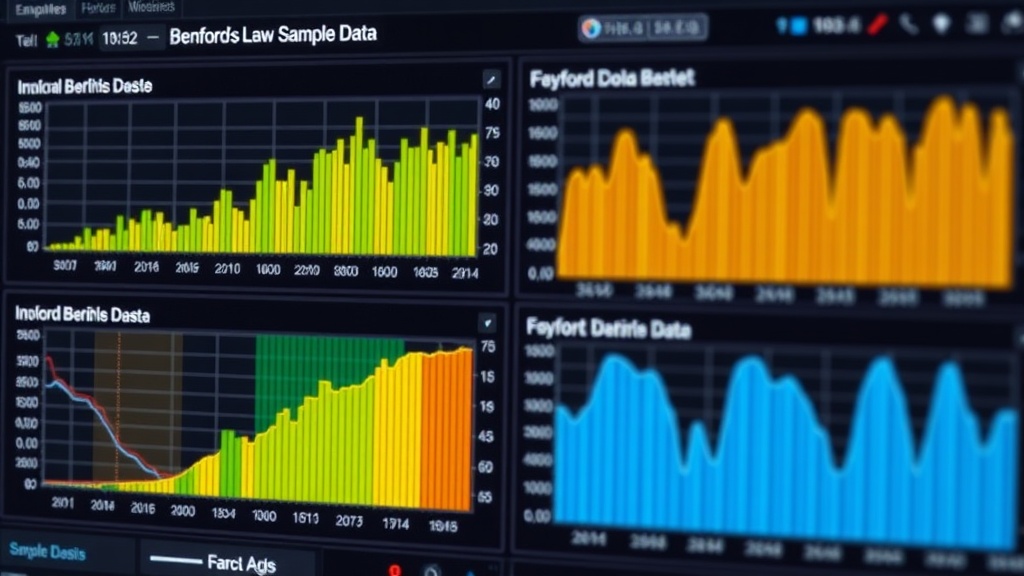
The tool takes a dataset as input and generates visualizations that compare the observed distribution of leading digits against the theoretical distribution predicted by Benford's Law. Users can upload their data, and the explorer will process it, providing immediate feedback on potential anomalies. This interactive nature transforms a theoretical concept into a practical analytical instrument.
How the Explorer Works
At its core, the explorer performs two main tasks: extracting the leading digit from each number in a dataset and then calculating the frequency distribution of these digits. For a number like 12345, the leading digit is 1. For 0.00789, the leading digit is 7. The tool handles various numerical formats, including integers and decimals, and accounts for potential edge cases like zero or negative numbers, which are typically excluded from Benford's Law analysis.
Once the leading digits are extracted, the explorer plots them. The primary visualization is a bar chart comparing the observed frequency of each leading digit (1 through 9) with the expected frequency according to Benford's Law. The expected frequencies are calculated using the formula: P(d) = log10(1 + 1/d), where 'd' is the leading digit.
Beyond the basic bar chart, the tool offers further analytical capabilities. It might include metrics like the Mean Absolute Deviation (MAD) between the observed and expected distributions, providing a quantitative measure of how well the data fits Benford's Law. A lower MAD indicates a better fit. The interface is designed to be intuitive, allowing users to upload data files (e.g., CSV, Excel) and see results almost instantaneously. This immediate feedback loop is crucial for exploratory data analysis.
Applications and Implications
The implications of an accessible tool for Benford's Law are significant. For forensic accountants and auditors, it offers a rapid first pass to identify transactions or accounts that might warrant closer scrutiny. If a company's expense reports or sales figures show a suspiciously uniform distribution of leading digits, or a strong bias away from Benford's Law, it could be an indicator of fabricated data.
Data scientists can use this explorer to validate the integrity of datasets before feeding them into machine learning models. Unnatural data distributions can lead to biased models and inaccurate predictions. By checking against Benford's Law, data professionals can gain confidence in the authenticity of their data sources.
Furthermore, researchers in fields ranging from economics to ecology can employ this tool to test hypotheses about the naturalness of their collected data. For instance, if a set of population figures for cities around the world deviates significantly from Benford's Law, it might prompt an investigation into the data collection methods or suggest external factors influencing population reporting.
The surprising detail here is not the existence of such tools, but their increasing accessibility. Previously, performing such analysis required specialized statistical software and expertise. Now, with interactive web-based explorers, this powerful anomaly detection technique is available to a much wider audience, democratizing data integrity checks.
The Future of Data Validation
As datasets grow larger and more complex, the need for efficient and reliable data validation methods becomes paramount. Tools like this interactive explorer for Benford's Law are crucial steps in ensuring data quality and trustworthiness. They empower users to question their data, not just accept it at face value.
What remains to be seen is how sophisticated these tools will become. Will they integrate more advanced statistical tests, or perhaps incorporate machine learning to identify more subtle patterns of deviation? For now, this explorer serves as a valuable resource, bringing a powerful statistical concept into the hands of everyday data practitioners.