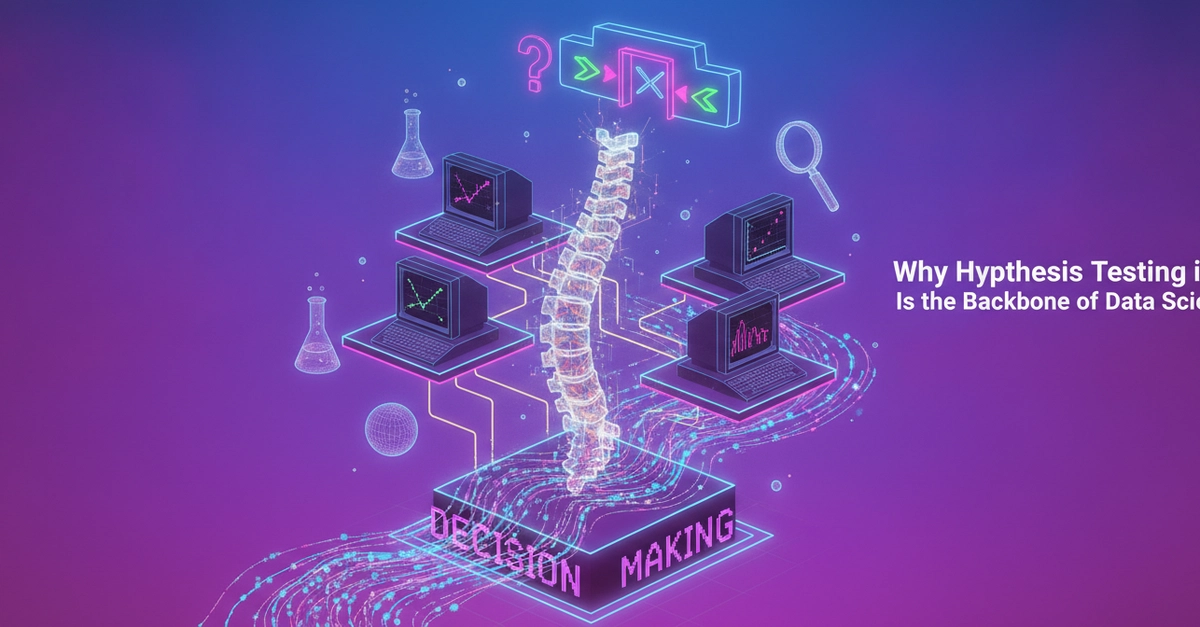
The Unseen Architect: Hypothesis Testing in Data Science
In the sprawling landscape of data science, where algorithms churn and insights emerge, a fundamental principle underpins every reliable conclusion: hypothesis testing. It is the rigorous, structured methodology that allows professionals to move beyond mere observation and make decisions backed by statistical evidence. Without it, data scientists would be adrift, unable to confidently distinguish genuine patterns from the ephemeral whispers of random chance. This process is not just an academic exercise; it is the backbone that supports trustworthy models, robust experiments, and ultimately, sound business strategies.
At its core, hypothesis testing provides a framework for evaluating claims about a population using sample data. It’s about asking a question, formulating a testable answer, and then rigorously examining the evidence to see if that answer holds water. This systematic approach is crucial for quantifying uncertainty, validating assumptions, and ensuring that the insights derived from data are not merely coincidental but represent a real phenomenon.
Formulating the Question: Null and Alternative Hypotheses
The journey of hypothesis testing begins with defining two competing statements about a population parameter. These are known as the null hypothesis (H₀) and the alternative hypothesis (H₁). The null hypothesis typically represents a default assumption or a statement of no effect, no difference, or no relationship. It’s the status quo, the baseline against which we test our observations. For example, H₀ might state that a new drug has no effect on blood pressure, or that there is no difference in conversion rates between two website designs.
The alternative hypothesis, conversely, represents what we are trying to find evidence for. It directly contradicts the null hypothesis and suggests that there *is* an effect, a difference, or a relationship. If H₀ is that the drug has no effect, H₁ might be that the drug *does* lower blood pressure. If H₀ is that there’s no difference in conversion rates, H₁ could be that one design *does* have a higher conversion rate than the other. The goal of hypothesis testing is to determine whether the sample data provides enough evidence to reject the null hypothesis in favor of the alternative.
The Statistical Gauntlet: Testing for Significance
Once hypotheses are set, the next step involves collecting sample data and performing statistical tests. These tests calculate a test statistic, which measures how far the sample data deviates from what would be expected if the null hypothesis were true. A common metric derived from this is the p-value. The p-value is the probability of observing a test statistic as extreme as, or more extreme than, the one computed from the sample data, assuming the null hypothesis is true. In essence, it quantifies the strength of evidence against the null hypothesis.
A small p-value (typically less than a predetermined significance level, alpha, often set at 0.05) suggests that the observed data is unlikely to have occurred by random chance alone if the null hypothesis were true. This leads to the rejection of the null hypothesis. Conversely, a large p-value indicates that the observed data is consistent with the null hypothesis, and we fail to reject it. It’s crucial to understand that failing to reject H₀ does not mean H₀ is true; it simply means the data did not provide sufficient evidence to discard it.
Beyond the Numbers: Types of Errors and Decision Making
The process of hypothesis testing is not infallible. There are two types of errors that can occur:
- Type I Error (False Positive): This occurs when we reject the null hypothesis when it is actually true. In our drug example, this would mean concluding the drug lowers blood pressure when it actually has no effect. The probability of a Type I error is denoted by alpha (α), the significance level.
- Type II Error (False Negative): This occurs when we fail to reject the null hypothesis when it is actually false. In the drug example, this would mean failing to detect that the drug *does* lower blood pressure. The probability of a Type II error is denoted by beta (β).
Data scientists must carefully consider the trade-off between these errors based on the context of the problem. For instance, in medical trials, a Type I error (approving an ineffective drug) might have severe consequences, while in A/B testing for website features, a Type II error (missing out on a beneficial change) might be less critical.
The Broad Impact: Hypothesis Testing in Practice
Hypothesis testing is not confined to a single domain within data science. It is woven into the fabric of numerous applications:
- A/B Testing: When companies test different versions of a webpage, advertisement, or product feature, hypothesis testing is used to determine which version performs better. For example, a data scientist might hypothesize that changing the color of a call-to-action button will increase click-through rates. They would then set up an A/B test, collect data, and use hypothesis testing to see if the observed difference in click-through rates is statistically significant.
- Clinical Trials: Pharmaceutical companies rely heavily on hypothesis testing to determine the efficacy and safety of new drugs. They hypothesize that a new drug is more effective than a placebo or existing treatment and use statistical tests to validate this claim.
- Quality Control: In manufacturing, hypothesis testing can be used to ensure that products meet certain quality standards. For instance, a factory might test if the average weight of a product falls within an acceptable range.
- Research and Development: Scientists across various fields use hypothesis testing to validate theories, test new hypotheses, and interpret experimental results.
The surprising detail here is not the complexity of the statistical tests themselves, but how universally applicable and fundamental they are. From optimizing a button color to approving life-saving medication, the same core principles of null and alternative hypotheses, p-values, and error types guide decision-making. This universality makes hypothesis testing an indispensable tool.
Why It's the Backbone
Hypothesis testing provides the essential rigor needed to trust data-driven insights. It transforms raw data into actionable intelligence by offering a structured way to:
- Validate Assumptions: Confirm whether initial beliefs or assumptions about data hold true.
- Quantify Uncertainty: Understand the probability that observed results are due to chance.
- Make Evidence-Based Decisions: Move from intuition to statistically supported conclusions, reducing the risk of costly mistakes.
- Ensure Reproducibility: Provide a clear framework for others to understand and potentially replicate analyses.
Without this statistical bedrock, data science would devolve into guesswork. It is the systematic process that allows us to confidently assert that a particular finding is real, not just a statistical anomaly. This confidence is what allows businesses to invest, researchers to publish, and engineers to deploy with certainty.