Automating Grafana Configuration with Provisioning Files
Managing Grafana instances, especially in dynamic environments, presents a significant challenge. Manually configuring dashboards, data sources, and alert rules is time-consuming and error-prone. The "destroy-recreate" paradigm, common in cloud-native architectures, exacerbates this issue: every time a Grafana instance is rebuilt, its configurations are lost unless externalized. Grafana's provisioning files offer a robust solution, enabling infrastructure-as-code principles for your monitoring stack. This approach allows you to define your Grafana setup in declarative configuration files, ensuring consistency and repeatability across deployments.
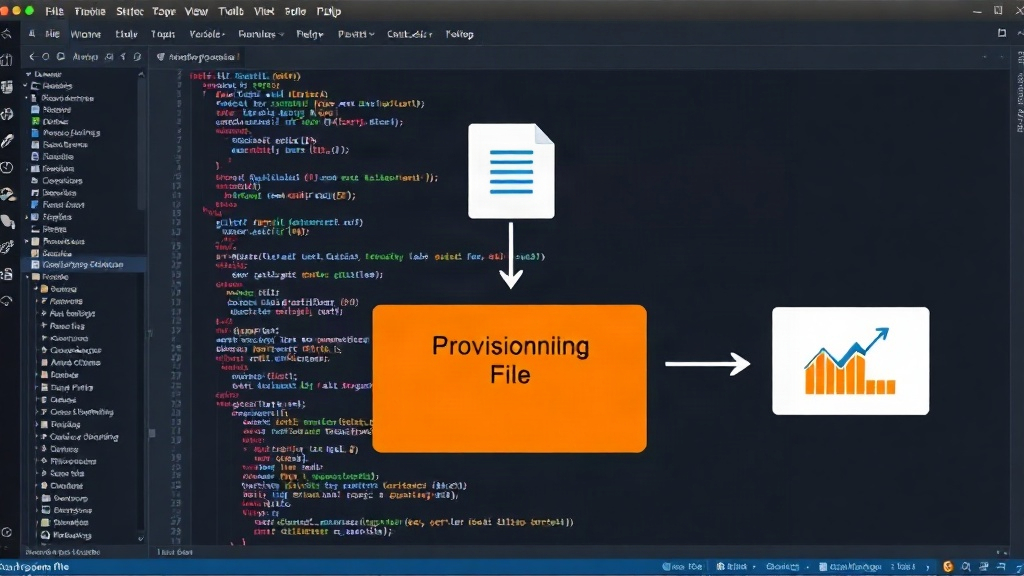
Provisioning files allow you to manage several key aspects of your Grafana instance: data sources, dashboards, folders, and alert notification channels. By treating these configurations as code, you can store them in version control, review changes, and automate their deployment. This is particularly critical for teams adopting GitOps or CI/CD pipelines, where infrastructure changes are triggered by code commits.
Key Grafana Components Managed by Provisioning
Grafana's provisioning system is designed to handle the declarative definition of core resources. The primary configurations are managed through YAML files placed in specific directories within the Grafana configuration path.
Data Sources
Defining your data sources programmatically is fundamental. Instead of logging into the Grafana UI and manually adding Prometheus, InfluxDB, or Elasticsearch endpoints, you can declare them in a YAML file. This file specifies the data source type, its name, URL, and authentication credentials (though sensitive credentials should ideally be managed via environment variables or secrets management systems). This ensures that any new Grafana instance automatically connects to your observability backends without manual intervention.
A typical data source provisioning file might look like this:
apiVersion: 1

datasources:
  - name: Prometheus
    type: prometheus
    access: proxy
    isDefault: true
    url: http://prometheus.example.com:9090
    jsonData:
      graphTooltip: "0"
Dashboards
Dashboards are the heart of Grafana's visualization capabilities. Provisioning allows you to import dashboards defined in JSON format. You can store your dashboard JSON files in a designated folder, and Grafana will automatically import them upon startup. This is invaluable for ensuring that essential monitoring views are present on every deployment. You can also set up folders to organize these dashboards logically.
To provision dashboards, you specify the folder where Grafana should look for JSON files:
apiVersion: 1

providers:
  - name: 'Default'
    orgId: 1
    folder: ''
    type: file
    disableDeletion: false
    editable: true
    options:
      foldersFromFiles: true
Grafana will then scan the specified folder (e.g., /etc/grafana/provisioning/dashboards/) for JSON files and import them.
Alert Notification Channels
Effective alerting is crucial for proactive incident response. Provisioning enables you to define alert notification channels, such as Slack, PagerDuty, or email. This ensures that Grafana is configured to send alerts to the correct destinations from the moment it's deployed.
An example of an alert notification channel configuration:
apiVersion: 1

cdots

notifications:
  - name: 'Slack Alerts'
    type: 'slack'
    isDefault: true
    sendTo: "#alerts"
    url: "https://hooks.slack.com/services/T00000000/B00000000/XXXXXXXXXXXXXXXXXXXXXXXX"
The "Destroy-Recreate" Problem Solved
In ephemeral infrastructure, services are often spun up and torn down automatically. If Grafana's configuration (dashboards, data sources, users, etc.) resides only within its internal database, it is lost each time the container or VM is destroyed. Provisioning files are read by Grafana only during its startup sequence. This means that when a new Grafana instance is started, it reads these files and configures itself. If the instance is then destroyed, the configuration is not lost because the provisioning files themselves are part of your infrastructure code, stored in a persistent location (like a Git repository or a configuration management system).
This approach is akin to how you might manage application code: you don't store the compiled binary on a server and expect it to persist through reboots. Instead, you store the source code and rebuild/redeploy as needed. Similarly, Grafana provisioning files are your source code for Grafana configuration. When Grafana starts, it uses this source code to build its state.
Best Practices for Grafana Provisioning
To effectively leverage Grafana provisioning, consider these best practices:
- Version Control Everything: Store all provisioning files (data sources, dashboards, users, etc.) in a Git repository. This provides an audit trail, facilitates collaboration, and enables rollbacks.
- Use Environment Variables for Secrets: Avoid hardcoding sensitive information like API keys or passwords directly in provisioning files. Instead, use Grafana's built-in support for environment variables to inject these secrets at runtime.
- Organize Provisioning Files: Structure your provisioning files logically, perhaps by environment (dev, staging, prod) or by functional area (e.g., a folder for database dashboards, another for application metrics).
- Separate Configuration from Data: Understand that provisioning files configure Grafana's *settings*, not the *data* it displays. The actual metrics and logs are stored in your backend data sources.
- Automate Deployment: Integrate provisioning file deployment into your CI/CD pipeline. This ensures that changes to your Grafana configuration are tested and deployed consistently.
The Unanswered Question: Granularity of User Management
While provisioning effectively handles data sources, dashboards, and notification channels, managing users and their permissions programmatically can be more complex. The current provisioning system allows for defining users and basic roles, but for highly granular role-based access control (RBAC) across many teams and projects, manual UI configuration or external authentication providers (like LDAP or OAuth) are often still necessary. What remains unclear is the long-term strategy for achieving fully declarative, code-driven user and permission management that scales to large, complex organizations without relying on external systems.
Conclusion
Grafana provisioning files are an indispensable tool for managing Grafana in any serious, production environment. They enable the "Grafana as Code" paradigm, directly addressing the "destroy-recreate" challenge by ensuring your monitoring setup is consistent and reproducible. By externalizing configurations to version-controlled files, you gain reliability, auditability, and the ability to integrate Grafana management into modern DevOps workflows.