Deploying the Elastic Stack on Kubernetes
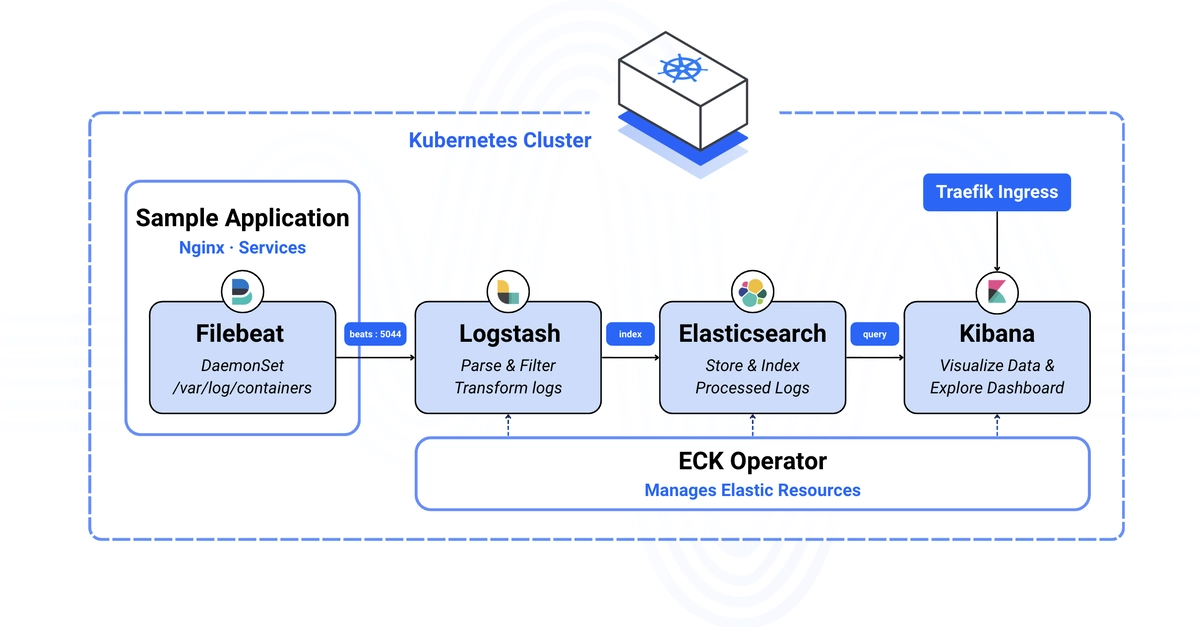
The Elastic Stack, comprising Elasticsearch, Logstash, Kibana, and Beats, is a powerful suite for real-time log collection, processing, storage, and visualization. Deploying this stack on Kubernetes offers significant advantages in terms of scalability, resilience, and automated management. This guide details the installation process using the Elastic Cloud on Kubernetes (ECK) operator, which simplifies cluster configuration, scaling, and upgrades. We will cover Elasticsearch for data storage and search, Logstash for data pipeline processing, Filebeat as a log shipper, and Kibana for data visualization, all secured with TLS via Traefik and Let's Encrypt.
Prerequisites:
- A Kubernetes cluster with at least 3 nodes, each with a minimum of 4GB RAM.
kubectland/orhelmcommand-line tools configured to communicate with your cluster.- A registered domain name for accessing Kibana (e.g.,
kibana.example.com).
Installing the ECK Operator
The ECK operator is the cornerstone of managing Elastic Stack deployments on Kubernetes. It automates complex operational tasks, allowing you to focus on data and insights. To install the operator, you first need to identify the latest stable release from the official ECK releases page on GitHub. This typically involves applying a YAML manifest that defines the operator's deployment, roles, and role bindings within your cluster.
The installation process usually involves downloading the operator manifest and applying it using kubectl. For example, you might use a command like kubectl apply -f https://download.elastic.co/downloads/eck/x.y.z/all-in-one.yaml, replacing x.y.z with the current version number. This single manifest deploys the operator and its necessary custom resource definitions (CRDs) to your cluster.
Configuring Elasticsearch
Once the ECK operator is running, you can define your Elasticsearch cluster using a custom resource. The operator watches for these custom resources and provisions the Elasticsearch cluster accordingly. This involves specifying the version, node count, resource allocation (CPU, memory), and storage requirements. ECK handles the underlying Kubernetes StatefulSets, Services, and PersistentVolumeClaims required for a robust Elasticsearch deployment.
A typical Elasticsearch custom resource might look like this:
apiVersion: elasticsearch.k8s.elastic.co/v1
kind: Elasticsearch
metadata:
  name: quickstart-es
spec:
  version: 8.10.2
  nodeSets:
  - name: default
    count: 3
    config:
      node.store.allow_mmap: false
    podTemplate:
      spec:
        containers:
        - name: elasticsearch
          resources:
            requests:
              memory: 4Gi
              cpu: 1
            limits:
              memory: 4Gi
              cpu: 2
    volumeClaimTemplates:
    - metadata:
        name: elasticsearch-data
      spec:
        accessModes:
        - ReadWriteOnce
        resources:
          requests:
            storage: 100Gi
        storageClassName: standard
This configuration defines a 3-node Elasticsearch cluster using version 8.10.2, allocates 4Gi of memory and 1 CPU to each node, and requests 100Gi of persistent storage per node using the standard storage class. The node.store.allow_mmap: false setting is often necessary in containerized environments where memory mapping might be restricted.
Setting up Kibana for Visualization
Kibana provides the user interface for exploring, visualizing, and managing your Elasticsearch data. Deploying Kibana with ECK is as straightforward as deploying Elasticsearch. You define a Kibana custom resource, referencing the Elasticsearch cluster it should connect to. ECK ensures that Kibana instances are deployed and configured to communicate with the Elasticsearch service. This includes setting up the necessary Kubernetes Services and Deployments.
Here's an example of a Kibana custom resource:
apiVersion: kibana.k8s.elastic.co/v1
kind: Kibana
metadata:
  name: quickstart-kb
spec:
  version: 8.10.2
  count: 1
  elasticsearchRef:
    name: quickstart-es
  http:
    service:
      spec:
        type: ClusterIP
    tls:
      selfSignedCertificate:
        disabled: true
This configuration creates a single Kibana instance linked to the quickstart-es Elasticsearch cluster. Crucially, tls.selfSignedCertificate.disabled: true is set, indicating that we will manage TLS termination externally, typically via an Ingress controller like Traefik.
Configuring Logstash for Data Ingestion
Logstash acts as the data processing pipeline, ingesting data from various sources, transforming it, and sending it to Elasticsearch. ECK also manages Logstash deployments. You define a Logstash custom resource, specifying the input plugins, filter plugins, and output plugins. The operator ensures Logstash instances are deployed and configured to connect to your Elasticsearch cluster. This includes setting up Kubernetes Services for Logstash itself and for its inputs if needed.
A sample Logstash configuration:
apiVersion: logstash.k8s.elastic.co/v1
kind: Logstash
metadata:
  name: quickstart-ls
spec:
  version: 8.10.2
  count: 1
  pipeline:
    workers: 2
    batch:
      size: 500
      delay: 5
  elasticsearchRef:
    name: quickstart-es
  http:
    service:
      spec:
        type: ClusterIP
This defines a Logstash instance that will process data using a pipeline configured via its inputs, filters, and outputs. It's set to connect to the quickstart-es Elasticsearch cluster. The workers and batch settings tune Logstash's processing performance.
Integrating Filebeat for Log Shipping
Filebeat is the lightweight log shipper that collects log files from your Kubernetes nodes or pods and forwards them to Logstash or directly to Elasticsearch. When deploying Filebeat with ECK, it's typically configured as a DaemonSet to run on every node in the cluster, or as a Deployment for specific applications. The ECK operator can manage Filebeat deployments, ensuring they are correctly configured to send data to your Logstash or Elasticsearch endpoints.
The configuration for Filebeat involves defining its inputs (e.g., paths to log files, Docker logs) and its outputs (e.g., Logstash host, Elasticsearch host). ECK simplifies this by allowing you to specify Filebeat configurations within the Elasticsearch or Logstash custom resources, or as a separate Filebeat custom resource. This ensures that logs from your applications running on Kubernetes are reliably captured and sent to the central ELK stack.
Securing with Traefik and Let's Encrypt
To make Kibana accessible from outside the Kubernetes cluster and secure it with TLS, an Ingress controller is essential. Traefik is a popular choice for Kubernetes due to its ease of use and dynamic configuration capabilities. By deploying Traefik as an Ingress controller and configuring it with a ClusterIssuer for Let's Encrypt, you can automatically obtain and renew TLS certificates for your Kibana domain.
The process involves:
- Installing Traefik as an Ingress controller in your cluster.
- Configuring a
ClusterIssuerresource for Let's Encrypt, providing your email address for notifications. - Creating an Ingress resource that routes traffic for your Kibana domain (e.g.,
kibana.example.com) to the Kibana service. Traefik will then automatically provision a TLS certificate from Let's Encrypt for this domain.
This setup ensures that Kibana is accessible via HTTPS, providing a secure endpoint for log analysis. The self-signed certificate in the Kibana resource is disabled to allow Traefik to handle TLS termination.
Conclusion
Deploying the ELK Stack on Kubernetes with the ECK operator provides a robust, scalable, and manageable solution for log aggregation and analysis. By leveraging ECK, you automate many of the complex operational tasks associated with running stateful applications like Elasticsearch, Logstash, and Kibana in a containerized environment. The integration with Ingress controllers like Traefik and services like Let's Encrypt further enhances security and accessibility, making your ELK stack a powerful tool for gaining insights from your application and system logs.