
The Mental Model: Start Cheap, Move Up
When a Docker container misbehaves—crashing, freezing, or acting erratically—the immediate instinct is often to restart, redeploy, or rebuild the image. This dramatic action, however, frequently bypasses simpler, faster solutions readily available through the command line. The key to efficient debugging lies in a disciplined, fixed sequence of checks, starting with the least resource-intensive commands and escalating only when necessary. This methodical approach, decided upon during calm periods, saves critical time when the pressure is on.
Every step described below incurs minimal cost and effectively rules out entire categories of potential problems. The discipline is to adhere strictly to the sequence, avoiding the temptation to jump ahead. This saves precious minutes, and potentially hours, by systematically eliminating variables.
Step 1: Inspect the Container Status
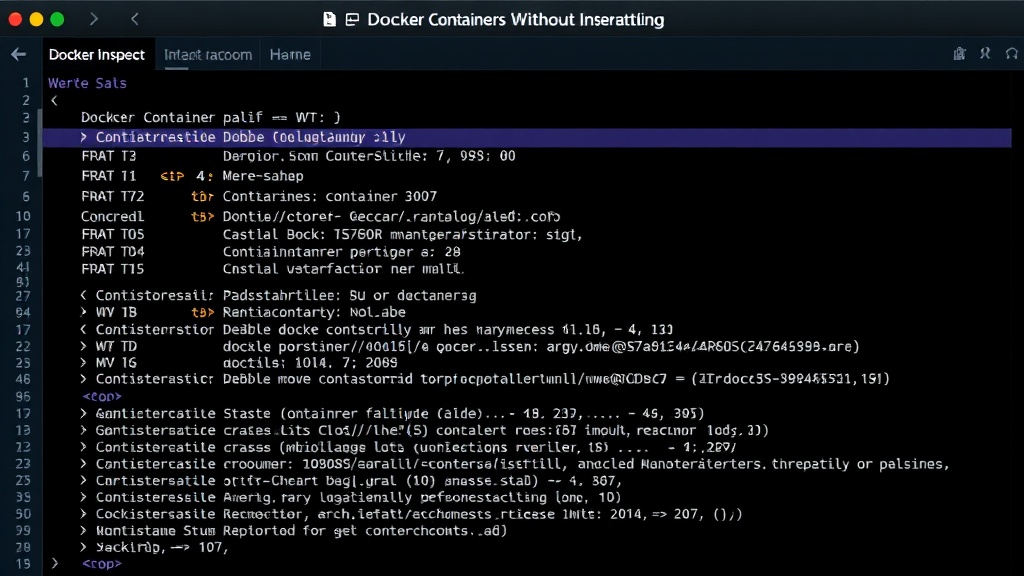
The first and cheapest check is to simply inspect the container's current state. This command provides a wealth of information without impacting the container's operation. It reveals the container ID, image, command, created time, status (e.g., running, exited, restarting), ports, and names. Crucially, it shows the exit code if the container has stopped. A non-zero exit code is a strong indicator of an application-level error within the container.
For example, if a container reports an 'Exited (1)' status, it signals that the primary process within the container terminated with an error. This immediately directs your attention to the application's logs or its entrypoint script. Conversely, a 'Running' status, despite apparent issues, suggests a problem with the application's responsiveness or resource contention, rather than a hard crash.
Step 2: Examine Container Logs
If the container is running but behaving erratically, or if it exited with an error code, the next logical step is to examine its logs. The docker logs command streams or retrieves the standard output and standard error from the container's main process. This is often the single most valuable source of information, as applications typically log errors, warnings, and important operational messages.
You can retrieve all logs using docker logs [container_id]. To follow the logs in real-time, use the -f flag: docker logs -f [container_id]. This is particularly useful for debugging issues that manifest over time or during specific operations. If the container is restarting frequently, docker logs --tail 100 [container_id] can help capture the final messages before a crash without overwhelming your terminal.
Step 3: Check Resource Utilization
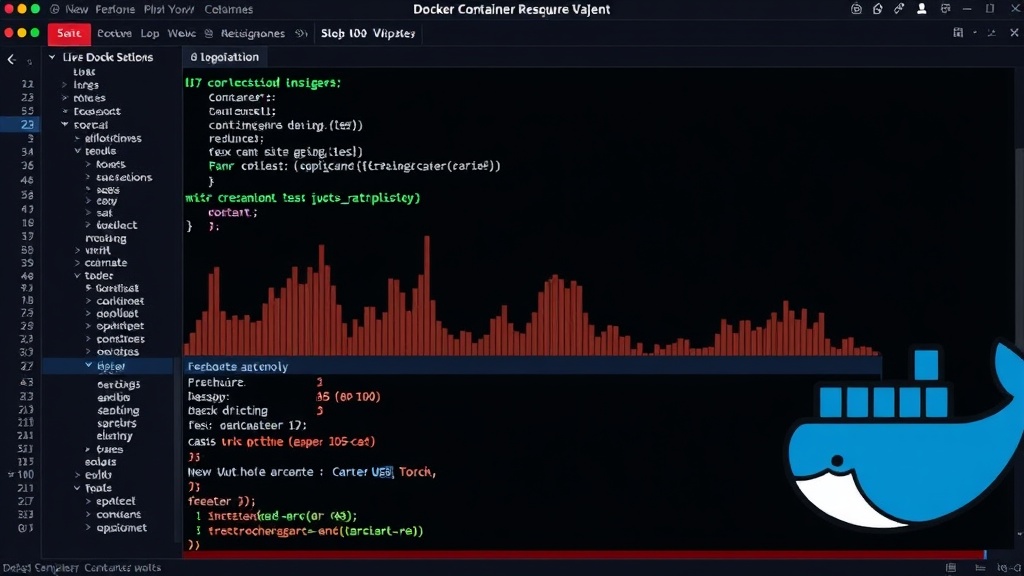
Resource starvation or excessive consumption can lead to container instability. The docker stats command provides a live stream of a container's resource usage, including CPU percentage, memory usage and limit, network I/O, and block I/O. Observing these metrics can reveal if a container is hitting its resource limits or consuming an unexpectedly high amount of CPU or memory.
For instance, a container consistently maxing out its CPU or approaching its memory limit is likely to become unresponsive or be terminated by the system. This command helps distinguish between application logic errors and infrastructure-level performance bottlenecks. Comparing the current stats against baseline performance can quickly highlight anomalies.
Step 4: Execute Commands Inside the Container
When the previous steps haven't yielded a clear answer, it's time to interact directly with the container's environment. The docker exec command allows you to run a new command within a running container. This is invaluable for inspecting the container's filesystem, checking running processes, or testing connectivity.
To get an interactive shell inside a running container, use docker exec -it [container_id] /bin/bash (or /bin/sh if bash is not available). Once inside, you can use standard Linux tools like ps aux to see processes, netstat -tulnp to check listening ports, ls -l /app to inspect files, or even try to run parts of your application manually. This step is like putting on a detective's magnifying glass, allowing you to examine the scene of the crime directly.
Step 5: Explore the Container's Filesystem
Sometimes, the issue might be related to configuration files, data corruption, or unexpected file changes. While docker exec can be used to browse, a more direct approach for complex filesystem issues is to copy files out of the container for analysis on your host machine. The docker cp command serves this purpose.
You can copy a specific file or directory from the container to your host: docker cp [container_id]:[/path/to/file/in/container] [/path/on/host]. Conversely, you can copy files into the container, which can be useful for deploying a quick fix or test configuration. This allows for detailed analysis with more powerful host-based tools.
Step 6: Inspect the Container Configuration
The docker inspect command, mentioned briefly in step 1, is a powerful tool for understanding the detailed configuration of a container. It returns a JSON object containing all configuration details, including environment variables, mounted volumes, network settings, entrypoint, command, and restart policies. This is crucial for verifying that the container was started with the intended settings.
For example, if your application expects a specific environment variable to be set, you can check its value within the inspect output. Similarly, incorrect volume mounts or network configurations can be identified here. This command acts as a final verification that the container's operational parameters match your expectations.
Step 7: Examine the Image
If all else fails, and especially if multiple containers based on the same image are exhibiting issues, the problem might lie within the Docker image itself. You can inspect the image layers, environment variables, and commands defined in the image using docker history [image_id] and docker inspect [image_id].
Understanding the image history can reveal unexpected commands or configurations added during the build process. Debugging the image build process itself might require examining the Dockerfile and rebuilding the image with verbose logging enabled. This step moves the focus from the running container instance to the blueprint from which it was created.
When to Escalate: Rebuild or Redeploy
Only after exhausting these inexpensive and non-disruptive CLI checks should you consider more drastic measures like rebuilding the image or restarting the entire service. By systematically working through these steps, you gain clarity on the root cause, enabling more targeted and effective solutions, rather than relying on guesswork and repeated restarts.