
The Illusion of Control: When Debuggers Mislead
Developers rely on debuggers as essential tools. They step through code, inspect variables, and unravel logic. This process assumes a direct, faithful representation of the program’s state. However, modern optimizing compilers, designed to make code run faster, can shatter this assumption. They transform source code into machine instructions in ways that often obscure the original structure, making the debugger’s view a distorted reflection of reality. This isn't a bug in the debugger; it's a consequence of aggressive compiler optimizations.
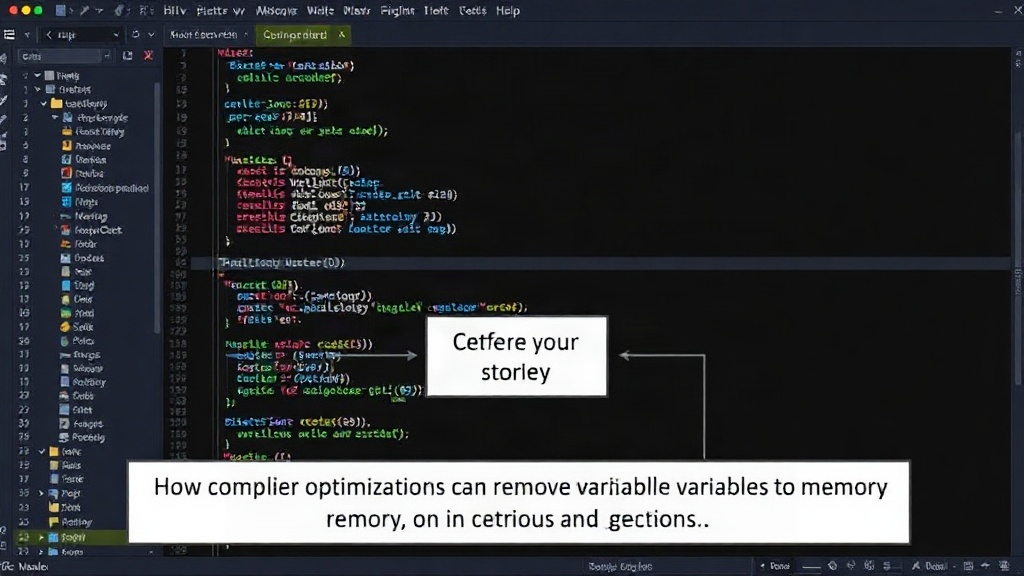
Consider a simple C++ snippet: `int x = 1; int y = x + 1;`. A naive compiler would generate instructions to load 1 into a register, then add 1 to that register, storing the result in `y`. The debugger would show `x` as 1 and `y` as 2. But an optimizing compiler might recognize that `y` is only used immediately after its initialization and its value is predictable. It could eliminate the `x` variable entirely, directly calculating `y = 2` and potentially never even storing `x` in memory.
When you set a breakpoint and inspect `x`, the debugger might report it as uninitialized, garbage, or even 0. This happens because the compiler has optimized away the storage for `x` altogether, or its value has been overwritten by later operations that the debugger isn't aware of. The variable truly doesn't exist in the generated machine code in a way that a debugger can easily map back to the source. The compiler is, in essence, lying to the debugger by presenting a state that is computationally equivalent but structurally different from what the source code suggests.
Common Culprits: Optimizations That Warp Reality
Several compiler optimization techniques are notorious for causing debugging headaches:
- Dead Code Elimination: Code that has no effect on the program's output or subsequent execution is removed. This can include variable assignments that are never read or computations whose results are discarded. If a debugger tries to inspect such a variable, its value might be undefined or the debugger might report that the variable is out of scope, even if it appears in the source code.
- Constant Folding and Propagation: Expressions with constant operands are evaluated at compile time. For example, `int z = 2 + 3;` becomes `int z = 5;`. If the compiler can determine the value of a variable throughout a function, it might replace all uses of that variable with its constant value, effectively eliminating the variable itself from the generated code. This means inspecting the variable during debugging might yield the constant value, or if the variable was truly optimized out, it might appear unavailable.
- Common Subexpression Elimination: If the same expression is computed multiple times, the compiler computes it once and reuses the result. This can lead to situations where a debugger shows the result of the first computation, but subsequent lines of code that appear to recompute the same expression might not actually execute that computation again.
- Inlining: Function calls are replaced with the body of the called function. This reduces function call overhead but can make debugging harder. If a function is inlined, breakpoints within that function might not be hit as expected, and variables local to the inlined function can behave erratically from a debugger's perspective.
- Register Allocation: Compilers strive to keep frequently used variables in CPU registers for faster access. When a variable resides only in a register and is not written back to memory, the debugger might not be able to find its value, especially if the register is reused for another purpose. The debugger typically relies on values stored in memory.
- Loop Unrolling: To reduce loop overhead, compilers can replicate the loop body multiple times and adjust the loop counter. This can make stepping through a loop feel unnatural, as a single iteration in the source code might correspond to many steps in the debugger, or vice-versa.
The Debugger's Dilemma: Reconciling Source and Machine Code
Debuggers work by correlating machine code instructions back to source code lines and variable names. This is achieved through debugging symbols, which are metadata generated by the compiler. Optimizing compilers make this mapping more complex. They might reorder instructions, eliminate variables, or move computations around. The debugger then has to make its best guess about the program's state based on the available information.
When a debugger shows a variable with an unexpected value, it's often because the variable's state in the source code doesn't directly map to a single, persistent memory location or register in the compiled output. The compiler might have computed the value, used it, and then discarded it or overwritten the memory location before the debugger could inspect it. Or, the value might exist only transiently in a CPU register that the debugger cannot reliably access.
This situation is particularly frustrating because it erodes trust in the debugging process. A developer sees `x` as 0 in the debugger, writes code based on that assumption, and then finds that the program behaves incorrectly at runtime. The root cause is the discrepancy between the debugger's view and the actual execution flow.
Strategies for Navigating Optimized Code
Dealing with these discrepancies requires a shift in debugging strategy. The key is to understand that the debugger is a tool that interprets compiled code, not a direct window into the source code's execution flow when optimizations are aggressive.
- Debug at Lower Optimization Levels: The most straightforward solution is to disable or reduce compiler optimizations during development. Most compilers offer flags like `-O0` (no optimization) for GCC/Clang or `/Od` (disable optimization) for MSVC. This ensures the compiled code closely mirrors the source code, making debugging much more reliable. The trade-off is slower build times and significantly slower execution, making it impractical for performance-critical sections or final testing.
- Use Specific Debugging Flags: Compilers often provide flags that enable some optimizations while retaining better debugging information. For example, `-Og` in GCC/Clang attempts to balance optimization with debuggability. Explore your compiler's documentation for such options.
- Inspect Memory Directly: If a variable appears incorrect, try inspecting the memory addresses that might have held it, or registers that the compiler is known to use. This requires a deeper understanding of assembly and compiler behavior but can reveal the true state.
- Add Logging Statements: Sometimes, the most reliable way to understand a variable's value at a specific point is to explicitly print it to the console or a log file. This forces the compiler to compute and store the value, making it visible. While this is a form of instrumentation, it's often more predictable than relying on a debugger with heavy optimizations.
- Understand Compiler Behavior: Educate yourself on common optimization techniques used by your compiler. Knowing that a variable might be optimized away or live only in a register can help you interpret the debugger's output more accurately. Reading compiler documentation and experimenting with different optimization levels can be very insightful.
- Temporary Variable Introduction: If a specific variable is causing trouble, try introducing a temporary variable in your source code just before the problematic line. This might force the compiler to allocate storage for this new variable, making it inspectable.
The Unanswered Question: When Does Debugging Become Too Costly?
What nobody has fully addressed yet is the long-term cost to developer productivity and software quality when teams rely heavily on highly optimized builds for debugging. While optimizations are critical for performance, the ensuing debugging challenges can lead to prolonged development cycles, subtle bugs that slip into production, and a general erosion of developer confidence in their tools. Finding the right balance between performance and debuggability, especially in complex, distributed systems, remains an ongoing challenge for the industry.
Ultimately, the debugger is not infallible. It's a sophisticated tool that translates between two different representations of a program. When the compiler performs aggressive transformations, the translation becomes more art than science, and developers must adapt their strategies to uncover the truth behind the optimized code.