The Shifting Sands of Field Data
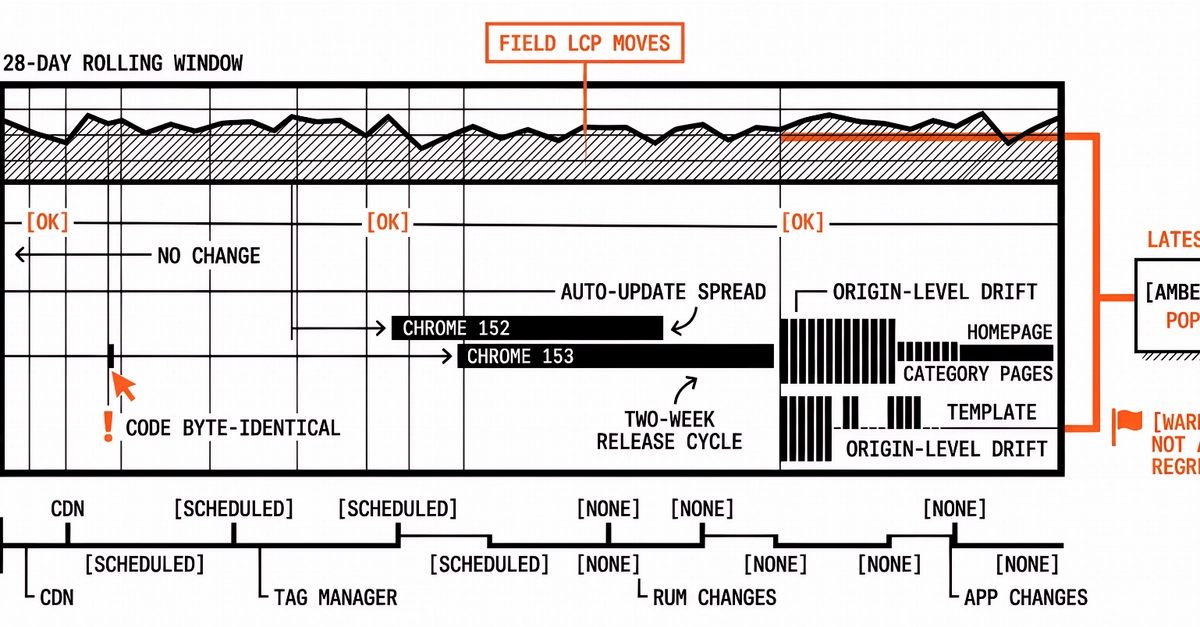
Your Largest Contentful Paint (LCP) metric in tools like PageSpeed Insights can change without your team deploying a single line of code. This isn't magic, nor is it necessarily a regression you introduced. The core reason lies in how Chrome User Experience Report (CrUX) data is collected and processed. CrUX is a 28-day rolling average of real Chrome user sessions. This means the data you see today represents performance from the past four weeks.
Starting September 8, 2026, with Chrome 153 Stable, Google will accelerate Chrome's release cycle to every two weeks. This change significantly impacts the reliability of field data for performance analysis. Previously, a longer release cycle meant that a single browser version's behavior dominated the 28-day window. Now, with bi-weekly releases, the 28-day window can encompass multiple major Chrome versions, each potentially exhibiting different rendering and interaction behaviors. Consequently, a shift in your LCP metric observed in field data might reflect the influence of a newer Chrome version that your users have automatically updated to, rather than a change introduced by your own code deployment.
The critical takeaway here is that an amber field band in your performance reports—especially after a seemingly quiet week—often signals a change in the population mix of Chrome versions being used by your visitors. This mix is influenced by how quickly users adopt new browser versions, which update channel they are on (Stable, Beta, Dev, Canary), and the speed at which auto-updates propagate across the user base. It is not, by itself, proof that your engineering team shipped a performance regression on a specific Tuesday.
Understanding the Lag: Pipeline vs. Rolling Window
To truly understand performance fluctuations, it's essential to differentiate between pipeline lag and rolling-window lag. Pipeline lag refers to the delay between when a user's browser collects performance data and when that data becomes available in reports like CrUX. This can be due to processing times, aggregation, and the sheer volume of data being handled by Google. Rolling-window lag, on the other hand, is inherent to the 28-day averaging period itself. Even if a performance fix is deployed and verified in lab tests, it can take weeks for its positive impact to be fully reflected in the 28-day average as older, slower data points are gradually replaced.
The new two-week release cadence for Chrome exacerbates this issue. Imagine a scenario: Your team deploys a critical performance optimization on a Monday. This change might appear in the Chrome Beta channel, then roll out to Stable two weeks later. However, by the time it hits Stable, another new version might already be in Beta, and the cycle continues. Within your 28-day CrUX window, you could have a mix of users on version X, version X+1, and potentially even version X+2, each with subtly different LCP behaviors. If a significant portion of your user base updates rapidly to version X+1, which might have a slightly different LCP rendering behavior for your specific page, you could see your LCP metric worsen in CrUX. This change would appear in your field data well before the 28-day window fully refreshes to only include data from version X+1 and beyond.
The 28-Day Field Window: A Shrinking Guarantee
Historically, the 28-day window provided a reasonable, albeit delayed, signal of real-world performance. It offered a buffer: if a problem occurred, you had a few weeks to identify it, deploy a fix, and then observe the field data slowly improve. With Chrome's new release schedule, this buffer is effectively halved in terms of the variety of browser behaviors that can be present within that window. A fix deployed today might not be fully represented by a homogenous set of browser versions in the CrUX report for up to four weeks. Furthermore, the next Chrome update could introduce new nuances that muddy the waters again.
This presents a challenge for developers and site owners. Relying solely on the CrUX 28-day average to validate performance improvements or diagnose regressions becomes less straightforward. A sudden jump in LCP might be attributable to a browser update's architectural changes rather than your own code. Conversely, a performance fix you deploy might be masked by the average, or its positive impact might not be immediately visible.
What This Means for Your Performance Strategy
If you run a website or web application, this shift demands a more nuanced approach to performance monitoring and analysis. Here’s what you need to consider:
- Augment CrUX with Lab Data: While CrUX remains invaluable for understanding real-user experience, its interpretation is becoming more complex. Always correlate field data trends with robust lab testing. Tools like Lighthouse, WebPageTest, and browser developer tools provide immediate feedback on performance changes tied directly to your code deployments.
- Monitor Channel Shifts: Pay closer attention to the distribution of Chrome versions among your users. Understanding how quickly your audience adopts new Stable releases can help you contextualize LCP changes. If you see a spike in LCP coinciding with a new Chrome version's widespread adoption, investigate that browser version's specific behavior.
- Focus on Deployments, Not Just Averages: When you deploy a performance-related change, track your lab metrics *before* and *after* the deployment. This direct correlation is your strongest indicator of success or failure. The field data will eventually catch up, but your internal metrics will tell you if your fix worked.
- Understand Population Mix: Recognize that LCP shifts can be influenced by factors beyond your control, such as the adoption rate of new browser versions. This doesn't mean you should ignore field data, but rather interpret it with a greater understanding of the underlying data collection mechanics.
The constant evolution of browser release cycles means that performance professionals must remain adaptable. The 28-day window is not a static benchmark; it's a dynamic reflection of user behavior, browser updates, and data processing. By layering lab data and understanding the intricacies of field data collection, you can navigate these changes and continue to deliver fast, reliable web experiences.