The Siloed Nature of Build Profiling
Developers often face a frustrating paradox: individual build tools report healthy performance, yet the overall build process drags. Cargo, the Rust compiler's build system, might show its compilation steps are efficient, and Ninja, a common build system for C/C++ projects, can confirm its own execution is swift. However, the time elapsed between Cargo finishing its work and Ninja starting its own, or vice-versa, remains invisible. This gap, this 'empty space' in the wall-clock timeline, represents critical time lost in complex build pipelines. Without a unified view, pinpointing the source of these delays becomes an exercise in guesswork, especially in continuous integration (CI) environments where build times can balloon to unacceptable lengths.
This fragmentation means that a 22-minute CI build could be suffering from significant inter-process delays, but neither Cargo nor Ninja, in isolation, would flag it. Cargo's `--timings` flag provides insights into Rust compilation phases, and Ninja's logs detail its task execution. But these tools operate in separate realities. Ninja has no awareness of Cargo's existence, and Cargo's own timing starts only when it's invoked, ignoring any pre-execution overhead. The problem is exacerbated when multiple build tools or stages are chained together, each operating independently and reporting only its internal performance metrics.
Introducing Buildline: A Unified Timeline
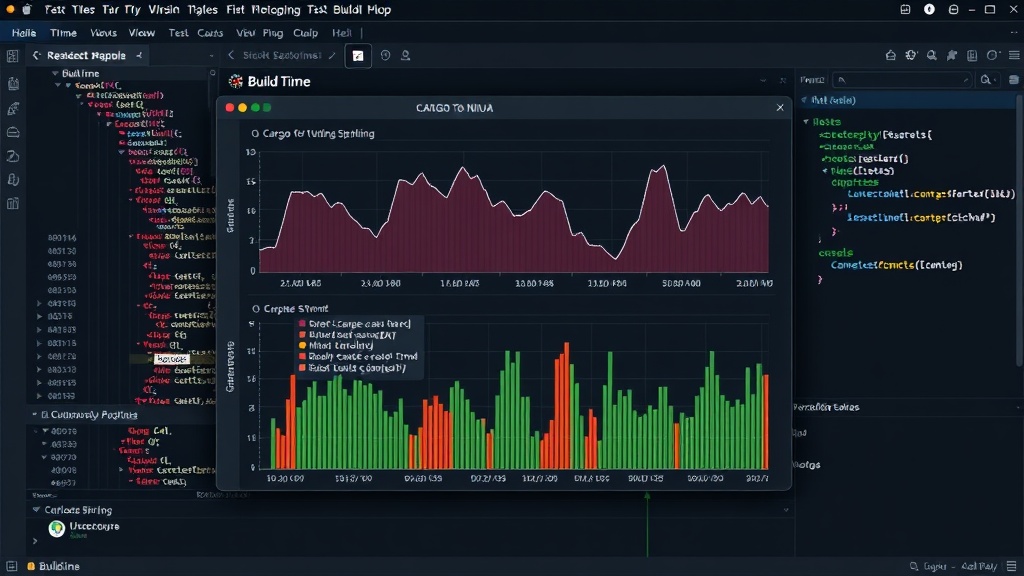
To address this critical blind spot, a new tool called buildline has emerged. Buildline's core function is to consolidate the profiling output from disparate build tools into a single, coherent wall-clock timeline. It achieves this by consuming the existing profiling data that tools like Cargo and Ninja already produce. The output is then standardized into the Chrome Trace Event Format. This format is widely supported and, crucially, can be directly opened in Perfetto, a powerful open-source performance analysis tool. This approach bypasses the need to develop and maintain a custom UI for visualizing build performance, leveraging an existing, robust solution.
The benefit of this unified timeline is immediate visibility into the gaps. When a build process involves multiple distinct stages managed by different tools, buildline visualizes these stages sequentially. The time spent waiting for one tool to complete before another can begin is no longer a hidden cost. It appears as explicit, measurable 'empty' segments on the timeline, clearly indicating where the system is idle. This makes it straightforward to identify bottlenecks that arise not from the efficiency of individual tasks, but from the coordination and handoff between them.
The Unexpected Revelation: The 'Empty Space'
The developer behind buildline, nabsei, shared a surprising discovery: the most significant time sinks were often not within the execution of Cargo or Ninja themselves, but in the intervals between their operations. A minimal Ninja build might complete in under a second, and a Cargo build might start a couple of seconds later. Individually, these durations are negligible. However, when viewed on a merged timeline, these seemingly small delays accumulate. The critical insight is that the 'gap' is precisely where optimization efforts should be focused, a fact that traditional, siloed profiling tools completely obscure. Buildline brings these hidden delays into sharp relief, allowing developers to see where time is truly being lost.
Consider a scenario where Cargo compiles Rust code and then invokes Ninja to link C++ objects. Cargo's profiler will report the compilation time. Ninja's logs will show the linking time. Buildline, however, will show the total elapsed time from the start of Cargo's compilation to the end of Ninja's linking, with a clear visual indication of any pause between Cargo's completion and Ninja's commencement. This is invaluable for understanding the end-to-end build performance, especially in large, multi-language projects or complex CI/CD pipelines.
How Buildline Works
Buildline operates by parsing the timing outputs of various build tools. For Cargo, this typically involves processing the JSON output from cargo build --timings=json. For Ninja, it means analyzing its build log files, which record the start and end times of each executed command. Buildline then correlates these events based on their timestamps and the overall build sequence. It maps these individual tool events onto a single chronological axis.
The output is a JSON file conforming to the Chrome Trace Event Format. This format is structured to represent events with start times, durations, and categories. When loaded into Perfetto or Chrome's `chrome://tracing` utility, these events are rendered as bars on a timeline. Each bar represents a specific task or phase (e.g., Rust compilation, C++ linking, test execution). The gaps between these bars represent idle time, precisely the kind of bottleneck buildline aims to expose. This standardized output ensures broad compatibility and leverages powerful existing visualization tools, making buildline an accessible solution for any developer struggling with opaque build performance issues.
Implications for Developers and CI/CD
The primary implication of buildline is a paradigm shift in how build performance is diagnosed. Instead of relying on individual tool reports, developers can now gain a holistic view of their entire build process. This is particularly impactful for large codebases, multi-language projects, and complex CI/CD pipelines where inter-stage dependencies and delays are common. By visualizing these hidden gaps, developers can identify and address the true sources of build slowdowns, leading to faster iteration cycles and more efficient CI/CD pipelines.
For founders and engineering leads, faster build times translate directly into developer productivity and reduced infrastructure costs. A 22-minute build might be reduced to 10 minutes by addressing these inter-process delays, saving countless developer hours per week and potentially reducing CI runner costs. The ability to pinpoint performance issues quickly also accelerates debugging and feature development, as developers spend less time waiting for builds to complete.
The tool's reliance on existing profiling outputs means it adds minimal overhead. It doesn't require intrusive instrumentation of the build process itself. Instead, it acts as an intelligent post-processor, making sense of data that is already available. This ease of integration makes it a compelling solution for teams looking to optimize their build infrastructure without significant engineering investment.