
The Problem: Data Silos in Personal Health
Your health and fitness data is fragmented. Apple Health resides on your iPhone, Oura Ring statistics are locked in its dedicated app, and Garmin’s running metrics live in yet another platform. For engineers and data enthusiasts, this fragmentation is a significant hurdle. The desire to understand the intricate connections between lifestyle choices and physiological responses – like how a late-night coding session impacts heart rate variability (HRV) and deep sleep – remains unfulfilled by these isolated systems. This is the core problem that the quantified self movement aims to solve: breaking down these data silos to gain a holistic view of personal well-being.
This tutorial addresses that challenge directly by focusing on Health Data Engineering. We will leverage powerful open-source tools to create a unified, professional-grade dashboard. The objective is to correlate sleep, activity, and recovery metrics, providing actionable insights that are impossible to glean from individual data sources.
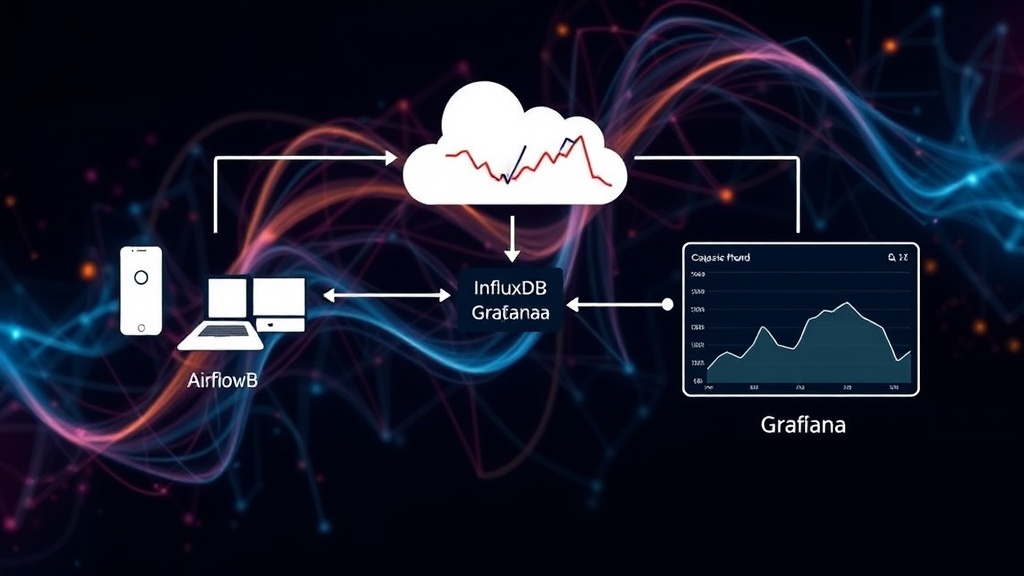
The Architecture: InfluxDB, Grafana, and Airflow
To build a robust system for collecting, storing, and visualizing personal health data, a specific architectural pattern is employed. This involves three key components:
- InfluxDB: A high-performance time-series database designed to handle the massive volume and velocity of data generated by health trackers and sensors. Its optimized structure for time-stamped data makes it ideal for storing metrics like heart rate, sleep stages, steps, and workout intensity over time.
- Grafana: An open-source analytics and visualization platform. Grafana excels at turning raw time-series data into intuitive, interactive dashboards. It allows users to create stunning graphs, charts, and gauges to represent complex health metrics, making trends and correlations easily visible.
- Airflow: An open-source platform to programmatically author, schedule, and monitor workflows. In this context, Airflow orchestrates the ETL (Extract, Transform, Load) process. It automates the extraction of data from various health APIs, transforms it into a consistent format, and loads it into InfluxDB.
This combination forms a powerful, flexible, and scalable solution for personal health data management. InfluxDB acts as the central repository, Grafana provides the user interface for analysis, and Airflow ensures the data pipeline runs smoothly and reliably.
Extracting Data: Connecting to Health APIs
The first critical step in building this dashboard is extracting data from its disparate sources. Each health platform (Apple Health, Oura Ring, Garmin, etc.) typically offers an API (Application Programming Interface) or a data export feature. The challenge lies in accessing this data programmatically.
For platforms like Apple Health, direct API access for third-party applications can be restricted on iOS due to privacy concerns. Often, this requires exporting data manually or using intermediary services that bridge the gap. For Oura and Garmin, developers can often register applications to gain API access, which then requires handling authentication (like OAuth) and making specific API calls to retrieve data points such as sleep duration, sleep stages, activity minutes, distance, heart rate, and HRV. The extracted data will typically be in formats like JSON or CSV.
This extraction phase is often the most technically challenging due to varying API limitations, authentication methods, and data formats. A common strategy is to develop custom scripts or leverage existing community-built libraries that abstract some of this complexity.
Transforming Data: Standardizing for InfluxDB
Once data is extracted, it needs to be transformed into a uniform structure before being loaded into InfluxDB. InfluxDB, as a time-series database, expects data in a specific format, typically involving a measurement, tags, fields, and a timestamp.
Measurements: Represent the type of data being tracked (e.g., `sleep`, `activity`, `heart_rate`).
Tags: Key-value pairs used for indexing and filtering (e.g., `device='Oura Ring'`, `activity_type='running'`).
Fields: The actual data values (e.g., `duration_minutes=480`, `steps=12000`, `hrv_rmssd=55`).
Timestamp: The exact time the data point was recorded.
The transformation process involves:
- Data Type Conversion: Ensuring numerical data is stored as numbers, strings as strings, etc.
- Unit Standardization: Converting all metrics to a consistent unit (e.g., all sleep duration in minutes, all distances in kilometers).
- Timestamp Alignment: Ensuring all timestamps are in a consistent format (e.g., UTC) and accurately reflect when the event occurred.
- Field Mapping: Mapping the potentially varied field names from different sources to a standardized set of field names in InfluxDB. For instance, 'deep_sleep' from Oura and 'DeepSleepMinutes' from another source might both map to a single `deep_sleep_minutes` field.
Airflow plays a crucial role here by defining these transformation steps within its Directed Acyclic Graphs (DAGs), ensuring consistency and repeatability.
Loading Data: Populating InfluxDB
With the data extracted and transformed, the next step is to load it into InfluxDB. InfluxDB provides client libraries for various programming languages, which Airflow can utilize. For Python, the `influxdb-client` library is commonly used.
The process involves iterating through the transformed data points and writing them to the appropriate InfluxDB measurements. For example, a sleep record might be written as:
from influxdb_client import InfluxDBClient, Point, WritePrecision

client = InfluxDBClient(url="http://localhost:8086", token="YOUR_API_TOKEN", org="YOUR_ORG")
write_api = client.write_api(write_options=SYNCHRONOUS)

point = Point("sleep") \
    .tag("device", "Oura Ring") \
    .field("duration_minutes", 480) \
    .field("deep_sleep_minutes", 120) \
    .field("rem_sleep_minutes", 90) \
    .field("light_sleep_minutes", 270) \
    .field("wake_time_minutes", 15) \
    .field("efficiency_percent", 92.5) \
    .time(datetime.utcnow(), WritePrecision.NS)

write_api.write(bucket="YOUR_BUCKET", org="YOUR_ORG", record=point)
This ensures that each piece of data is accurately timestamped and tagged, allowing for efficient querying and analysis later. Airflow’s task management ensures that these writes are handled efficiently, retrying on failure and logging the process.
Visualizing Insights: Building the Grafana Dashboard
Once the data populates InfluxDB, Grafana becomes the tool for making sense of it all. Grafana connects directly to InfluxDB as a data source. Users can then build dashboards by creating individual panels, each representing a specific query against the InfluxDB data.
For a health dashboard, panels might include:
- Daily Sleep Overview: A graph showing total sleep duration, deep sleep, REM sleep, and wake time over the past week or month.
- Activity Trends: Charts displaying daily steps, distance covered, and active calories burned.
- Heart Rate Variability (HRV): A line graph showing daily HRV (e.g., RMSSD) trends, often correlated with sleep quality and recovery.
- Workout Performance: Visualizations of workout duration, intensity (e.g., heart rate zones), and specific metrics like pace or power output for runners or cyclists.
- Correlations: Panels designed to visually link different metrics. For example, plotting daily HRV against daily sleep duration or comparing workout intensity with subsequent sleep quality.
Grafana’s flexibility allows for highly customized dashboards. Users can select different graph types (line charts, bar charts, gauges, heatmaps), set alert thresholds, and even create dynamic dashboards that adjust based on selected time ranges or filters. This transforms raw data into a narrative about one's health and lifestyle.
The Ultimate Question: Correlating Lifestyle and Health
The true power of this setup lies in its ability to answer complex questions about personal health. By unifying data from various sources, you can finally correlate seemingly disparate activities and physiological responses. For example:
- Sleep and Performance: Does a particularly intense workout negatively impact deep sleep the following night? How does sleep duration correlate with daily energy levels or cognitive performance?
- Stress and Recovery: How do periods of high work stress (potentially inferred from activity levels or lack of breaks) affect HRV and sleep quality?
- Diet and Activity: While not covered in this specific tutorial, future iterations could integrate nutritional data to see its impact on energy levels and recovery.
This unified dashboard moves beyond simply tracking metrics to understanding the causal relationships within one's own body and lifestyle. It empowers users with data-driven insights to optimize their health, training, and overall well-being.
Future Considerations and Extensions
This architecture provides a robust foundation. Future extensions could include:
- More Data Sources: Integrating data from smart scales, continuous glucose monitors (CGMs), or even environmental sensors (temperature, air quality).
- Advanced Analytics: Implementing machine learning models within Airflow or separate services to predict future health trends or identify anomalies.
- Automated Insights: Developing more sophisticated alerts or automated reports based on detected patterns.
- Data Privacy: Ensuring robust security measures for sensitive health data, especially if hosting the system outside a personal network.
By building a personalized health data pipeline, individuals can reclaim their data from walled gardens and gain unprecedented insights into their own physiology.