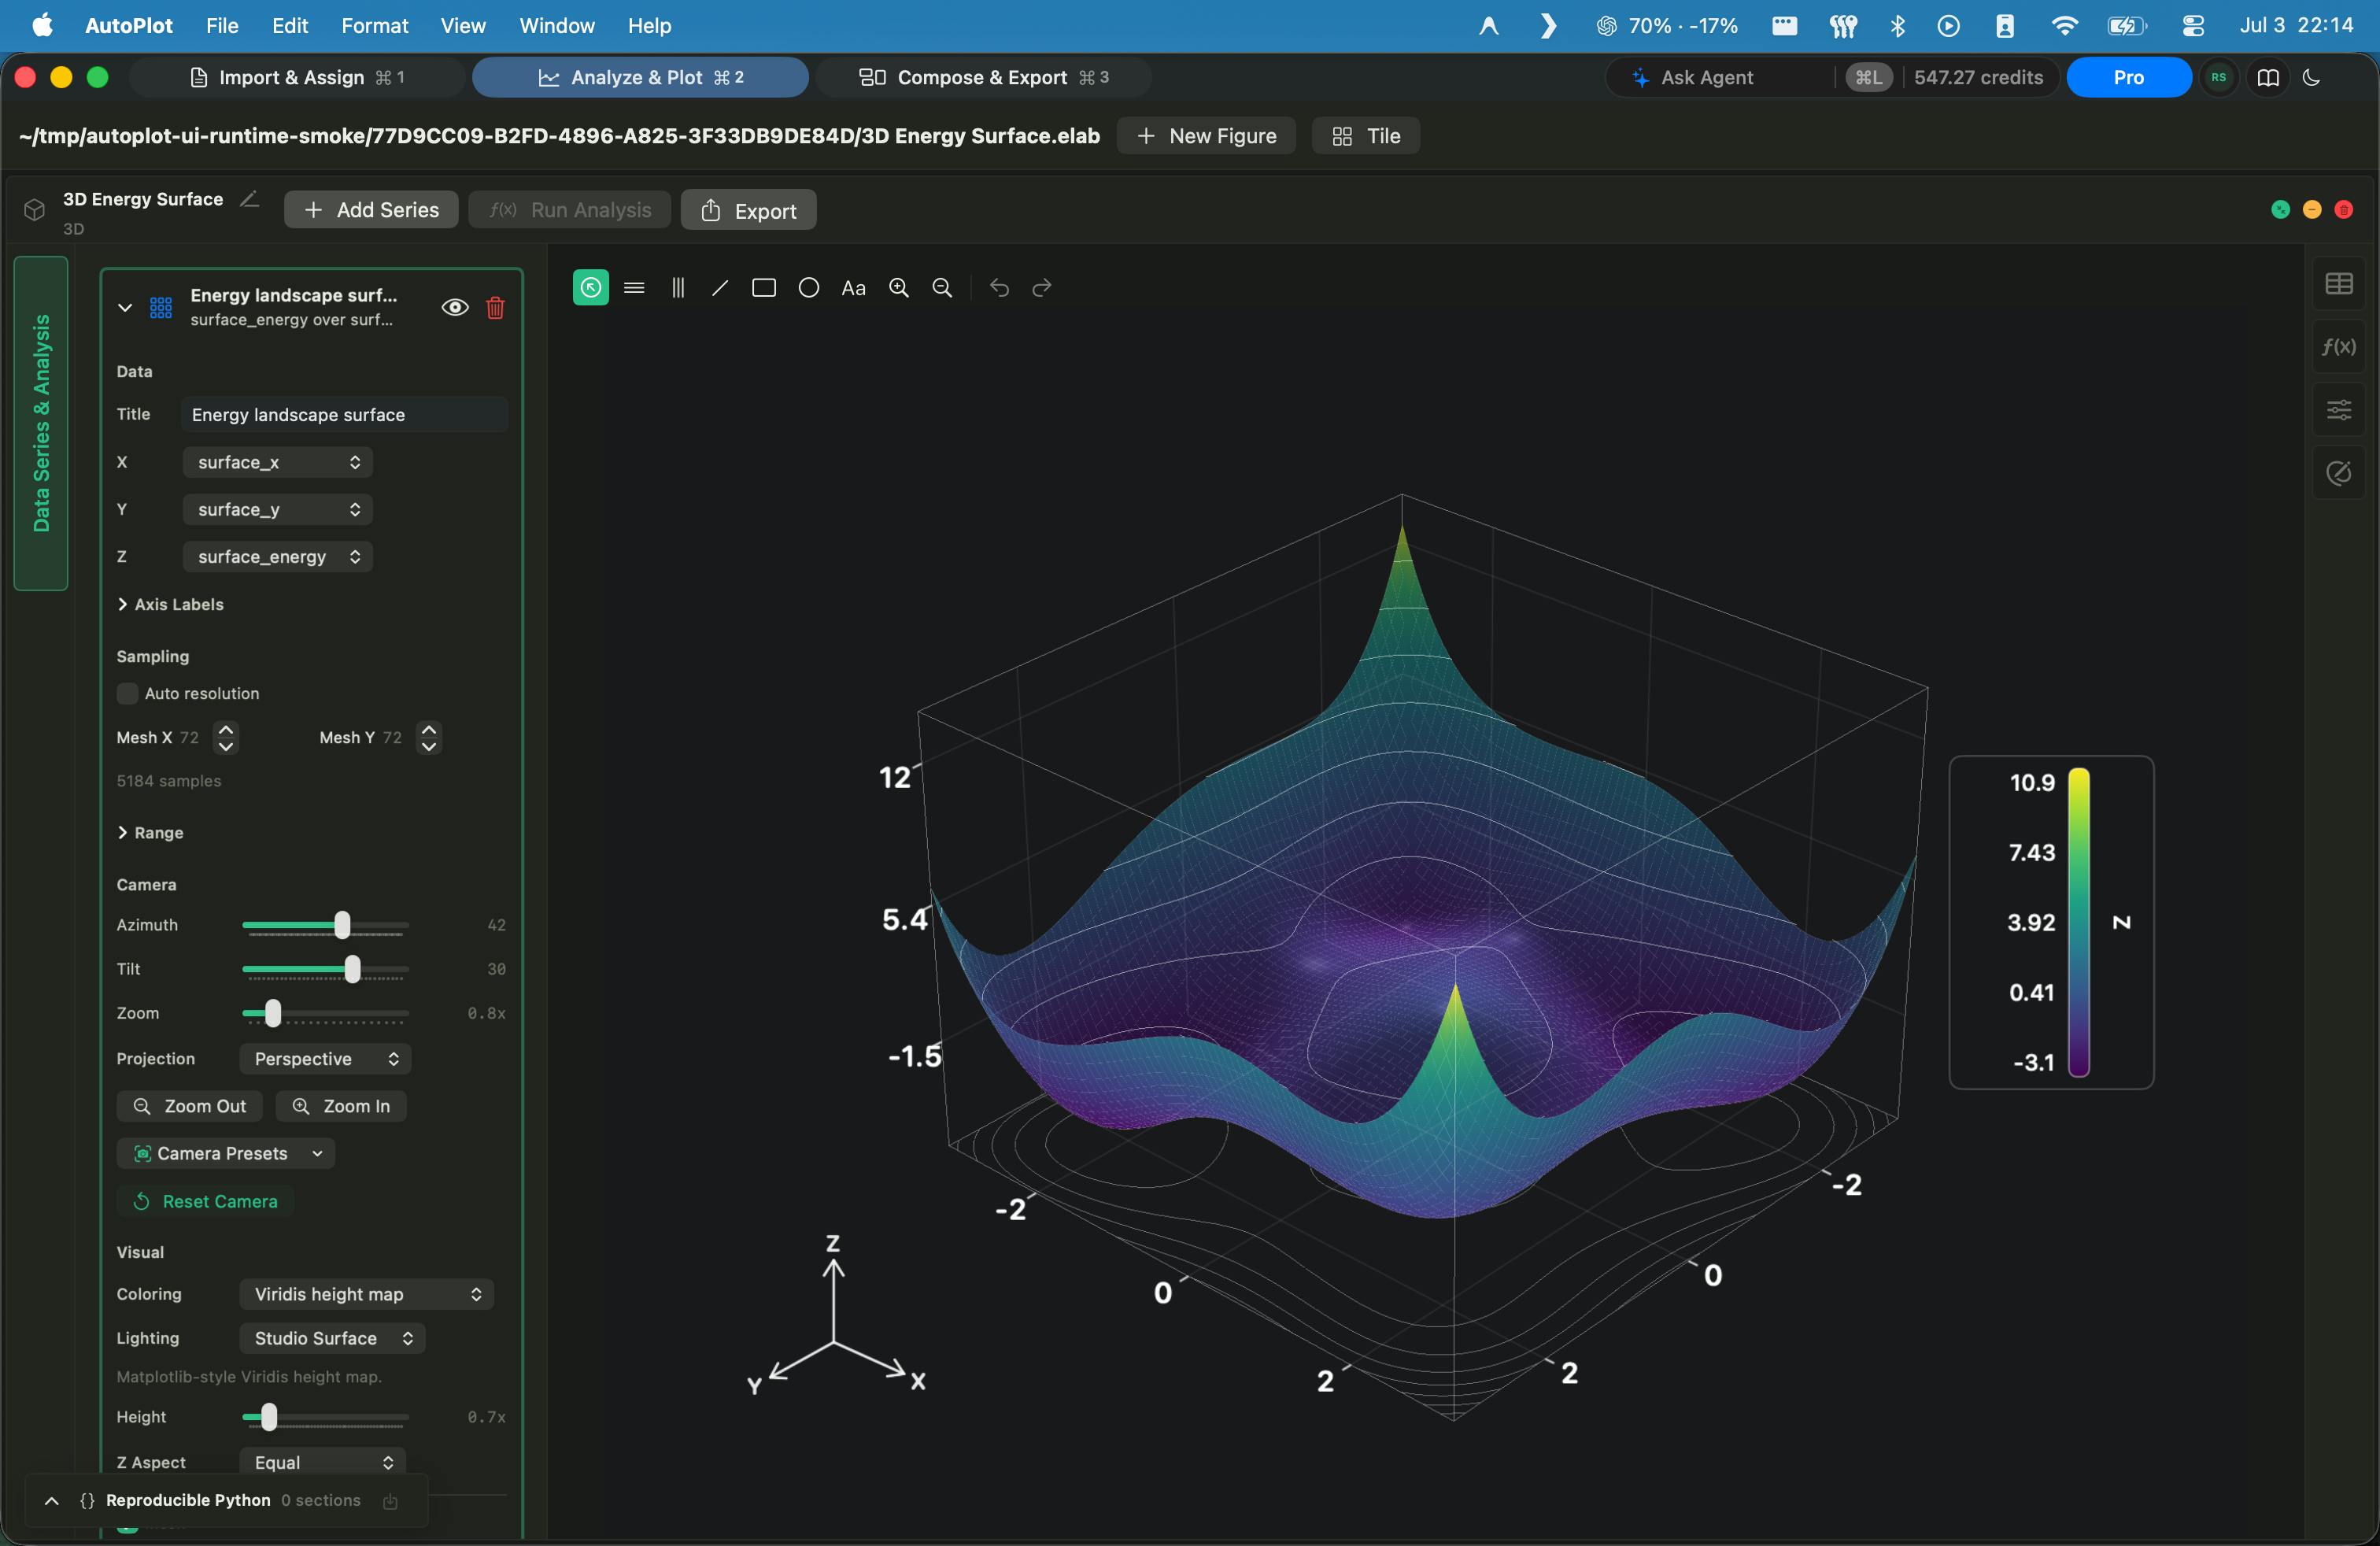
Autoplot: A Unified Approach to Data Analysis
Autoplot emerges as a new contender in the data analysis and visualization landscape, promising to consolidate the often-fragmented workflow of data exploration into a single, powerful workspace. The platform targets researchers, analysts, and anyone who regularly grapples with transforming raw data into insightful visual narratives. Traditionally, this process involves a cascade of tools: one for data cleaning and manipulation, another for statistical analysis, and a third for creating plots and charts. Autoplot aims to break this chain by integrating these disparate functionalities, reducing context switching and accelerating the iterative process of discovery.
The core philosophy behind Autoplot is to provide an environment where users can import, clean, analyze, and visualize their data without leaving the application. This is particularly beneficial for complex datasets that require extensive preprocessing before meaningful insights can be extracted. By bringing these steps under one roof, Autoplot seeks to lower the barrier to entry for sophisticated data analysis, making it more accessible to a wider audience.
Key Features and Functionality
Autoplot's ambition to unify data analysis and plotting is supported by a suite of features designed for efficiency and power. At its heart is a robust data ingestion capability, capable of handling various file formats and data sources. Once data is loaded, users can employ a range of tools for cleaning and transformation. This includes functionalities for handling missing values, data type conversions, and feature engineering, all accessible through an intuitive interface.
Beyond data preparation, Autoplot integrates analytical tools that allow users to perform statistical tests, build models, and derive quantitative insights directly within the workspace. This means that the transition from raw data to statistical significance is seamless. The platform's visualization engine is designed to be both flexible and user-friendly. Users can create a wide array of plot types, from simple scatter plots and bar charts to more complex heatmaps and network graphs. The ability to customize these visualizations extensively ensures that the final output accurately reflects the data and effectively communicates findings.
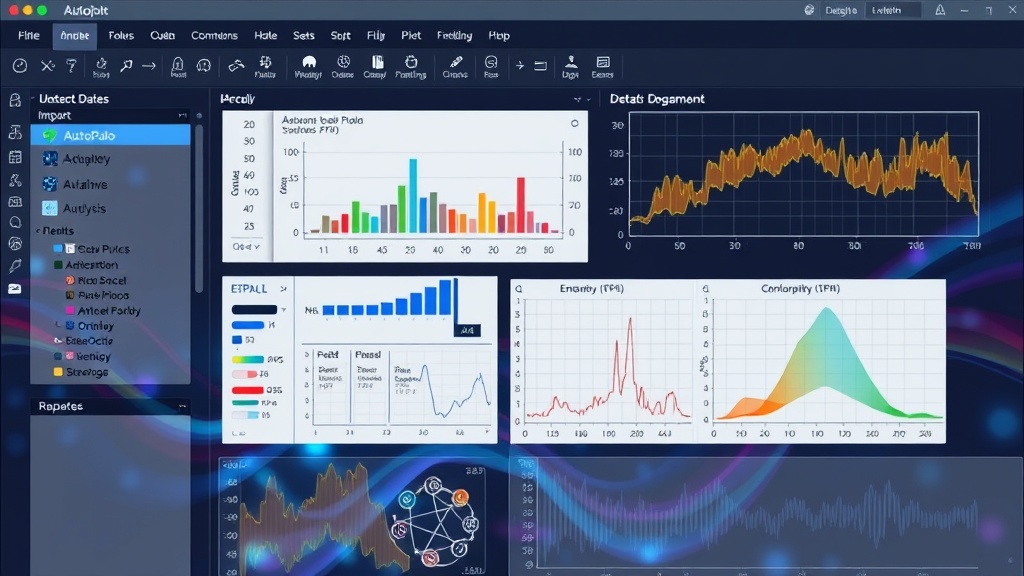
One of the standout aspects of Autoplot is its interactive plotting capabilities. Users can dynamically explore their data by zooming, panning, and selecting data points directly on the plots. This interactivity allows for real-time hypothesis testing and a deeper understanding of data distributions and relationships. The platform also supports scripting for more advanced users who require programmatic control over their analysis and visualizations, bridging the gap between GUI-based operations and code-driven workflows.
The Problem Autoplot Solves
The proliferation of specialized data tools has created a fragmented ecosystem. Data scientists and analysts often spend a significant portion of their time juggling multiple software packages, each with its own learning curve and data format requirements. This not only consumes valuable time but also introduces opportunities for errors during data transfer or reformatting. For instance, a researcher might export data from a statistical package, import it into a plotting tool, and then manually adjust parameters, only to realize a preprocessing step was missed and have to start the cycle again.
Autoplot's unified workspace directly addresses this inefficiency. By providing a single environment for the entire data analysis lifecycle, it minimizes the need for data export and import, thereby reducing the risk of errors and saving considerable time. Think of it less like a collection of specialized tools and more like a skilled assistant who can perform all your data-related tasks without needing to hand off work between departments. This integrated approach is crucial for rapidly iterating on hypotheses and extracting timely insights, especially in fast-paced research or business environments.
Target Audience and Use Cases
Autoplot is designed for a broad spectrum of users who work with data. This includes academic researchers across various disciplines—from biology and physics to social sciences—who need to analyze experimental results and present findings. Business analysts can leverage Autoplot to explore market trends, customer behavior, and operational performance. Data scientists will find its integrated environment beneficial for rapid prototyping and exploratory data analysis. Even students learning data science can use Autoplot as a comprehensive tool to understand the end-to-end data analysis process without getting bogged down by toolchain complexity.
Specific use cases could range from analyzing large scientific datasets to visualize astronomical phenomena, to exploring financial market data to identify trading patterns, or to dissecting survey results to understand public opinion. The platform's flexibility suggests it can adapt to diverse analytical needs, making it a versatile addition to any data professional's toolkit.
The Future of Integrated Data Workspaces
Autoplot's introduction signals a growing trend towards integrated platforms in data science. As datasets become larger and more complex, and the demand for quicker insights intensifies, the value of tools that streamline workflows will only increase. The success of Autoplot will likely depend on its ability to balance power and usability, offering deep analytical capabilities without alienating users who prefer simpler interfaces. Furthermore, its extensibility and integration with other tools will be key factors in its long-term adoption.
What remains to be seen is how Autoplot will evolve to incorporate emerging techniques in machine learning and AI-driven data analysis. As these fields advance, the need for tools that can seamlessly integrate advanced modeling techniques with intuitive visualization will become paramount. Autoplot's current foundation suggests a strong potential for such integration, positioning it as a platform to watch in the evolving data analytics space.