The AI Agent Debugging Dilemma
Building sophisticated AI agents often feels like navigating a maze in the dark. You craft intricate prompts, connect them to external APIs, and run tests. Five successful runs, then disaster strikes: an infinite loop, a cascade of LLM calls draining your credits, and an empty response. Traditional debugging tools, like stack traces for conventional applications, are woefully inadequate here. The non-deterministic nature of LLM responses and the dynamic branching of agent logic create a black box that standard logs can't illuminate. This opacity makes building production-ready AI agents a high-stakes gamble.
The core problem lies in the emergent behavior of these agents. Unlike predictable code execution, an AI agent's path can shift based on subtle variations in input or LLM output. This makes it nearly impossible to pinpoint the exact sequence of operations leading to an error. Was it a specific API call that failed? Did the LLM hallucinate at a critical juncture? Did the agent's internal state become corrupted? Without visibility into the agent's internal thought process and execution flow, these questions remain unanswered, leading to frustrating and costly debugging cycles.
Introducing Distributed Tracing for AI
The solution to this visibility gap is distributed tracing, a technique traditionally used for monitoring microservices. When applied to AI agents, it transforms them from opaque systems into transparent workflows. Distributed tracing captures the entire lifecycle of a request as it flows through various components, including LLM calls, API interactions, and internal agent logic. Each step, or 'span,' is recorded with its timing and context, allowing developers to reconstruct the execution path and identify bottlenecks or errors.
OpenTelemetry, an open-source observability framework, provides the standard for instrumenting applications. It defines how to generate, collect, and export telemetry data (traces, metrics, logs). By integrating OpenTelemetry into your AI agent, you can automatically capture detailed information about each operation. This includes not just the duration of LLM calls but also the input prompts, the generated responses, and any intermediate data transformations. This granular data is crucial for understanding the agent's behavior under different conditions.
SigNoz: Your Open-Source Observability Backend
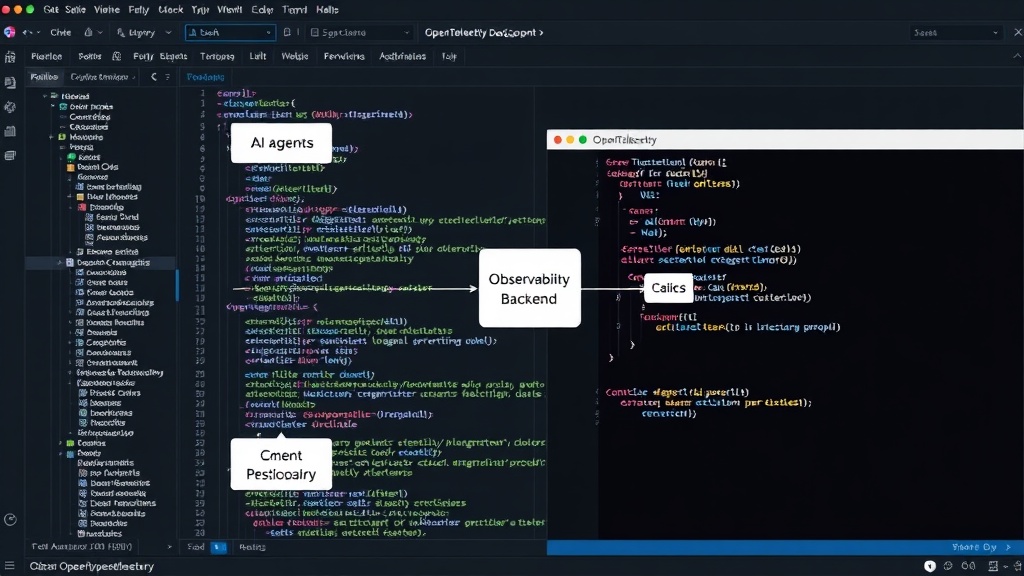
While OpenTelemetry collects the data, you need a backend to store, query, and visualize it. This is where SigNoz comes in. SigNoz is an open-source Application Performance Monitoring (APM) tool built on a unique architecture that combines traces, metrics, and logs into a single UI. For AI agents, its strength lies in its ability to display distributed traces in an intuitive, hierarchical format. This makes it easy to explore nested spans, which are essential for understanding the complex, multi-layered calls characteristic of AI agents.
Setting up SigNoz locally is straightforward, allowing developers to experiment and debug their agents without relying on external SaaS solutions. Once SigNoz is running, you can point your OpenTelemetry-instrumented AI agent to it. The platform then ingests the trace data, presenting it as a visual flow. You can see exactly how many times an LLM was called, the duration of each call, and the specific prompt and response for each instance. This level of detail is unprecedented for debugging AI agents, turning a black box into a clear, navigable process.
Instrumenting a Python AI Agent
To illustrate the process, consider a Python AI agent. You would typically use libraries like LangChain or LlamaIndex, which often have built-in support or easy integrations for OpenTelemetry. The key is to wrap your agent's execution logic and its interactions with LLMs and external tools with OpenTelemetry’s tracing capabilities.
For example, using the OpenTelemetry Python SDK, you can create a tracer and start spans for distinct operations. A span might represent an entire agent turn, a call to a specific LLM, or an interaction with a search API. Within these spans, you can record attributes such as the prompt sent to the LLM, the model name used, and the API endpoint called. If an LLM call returns an error, or if an API call times out, this information is captured directly within the span, providing immediate context for the failure.
The benefit of this approach is that it doesn't require significant modifications to your existing agent code. You're essentially adding a layer of observability that records the execution flow without fundamentally altering the agent's logic. This makes it feasible to implement tracing in both new and existing AI projects.
Inspecting Nested Spans for Root Cause Analysis
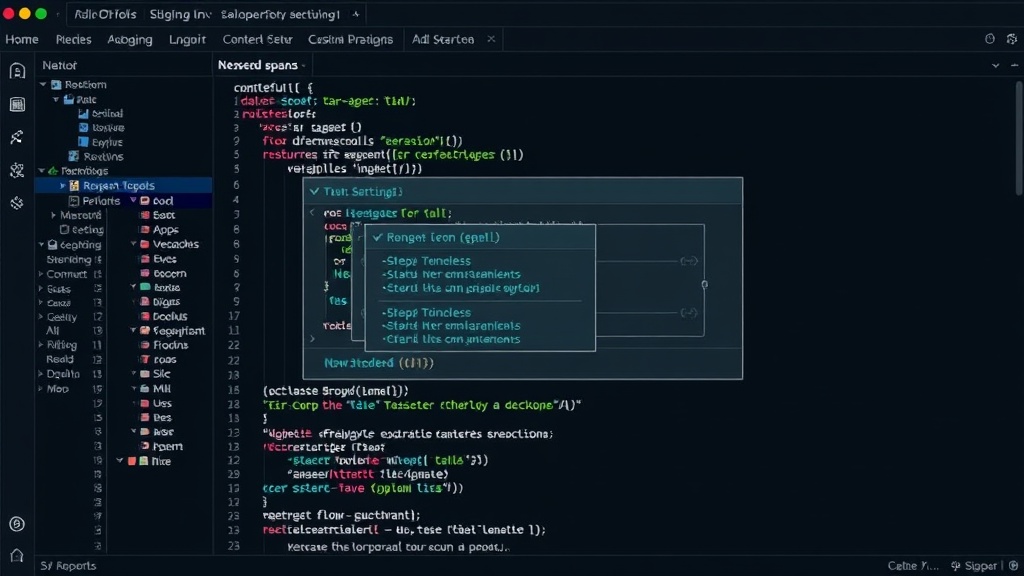
The real power of distributed tracing for AI agents emerges when you inspect the nested spans. An agent might first call an LLM to determine the next action. This LLM call itself might involve multiple internal LLM calls if the model is complex or uses techniques like chain-of-thought prompting. Then, based on the LLM's output, the agent might call an external API, which could involve its own set of sub-operations. Each of these is a nested span within the parent span representing the agent's turn.
SigNoz visualizes these nested spans as a tree or waterfall diagram. If an agent is looping, you can see repeated spans. If an LLM call is taking too long, its span will be unusually long. If an API returns an error, the span for that API call will clearly indicate the failure and its associated error message. This hierarchical view allows you to drill down from the top-level agent execution to the specific, granular operation that caused a problem. It's like having a detailed map of the agent's decision-making process, revealing precisely where and why things went awry.
What This Means for Production AI
The ability to reliably debug AI agents is not just a convenience; it's a prerequisite for deploying them in production. Without robust observability, teams are hesitant to entrust critical tasks to AI agents, fearing unpredictable failures and opaque error states. OpenTelemetry and SigNoz provide the necessary tools to build confidence in these systems. Developers can now monitor agent performance, identify regressions, optimize resource usage (like LLM token consumption), and ensure reliability.
This shift from a black box to a transparent system also has implications for collaboration and iteration. When an agent behaves unexpectedly, the trace data provides objective evidence for what happened, facilitating discussions between developers, prompt engineers, and stakeholders. It allows for faster iteration cycles by pinpointing areas for improvement, whether it's refining prompts, optimizing API integrations, or adjusting agent logic. Ultimately, this observability empowers teams to build more robust, efficient, and trustworthy AI agents ready for real-world deployment.