The Bedrock Beneath the Buzzwords
When the term data science is mentioned, minds often leap to Python scripts, SQL queries, sophisticated machine learning algorithms, or the futuristic promise of artificial intelligence. These are undoubtedly crucial components, the visible architecture of modern data-driven endeavors. Yet, beneath this impressive superstructure lies a fundamental discipline that underpins much of what data scientists do: statistics.
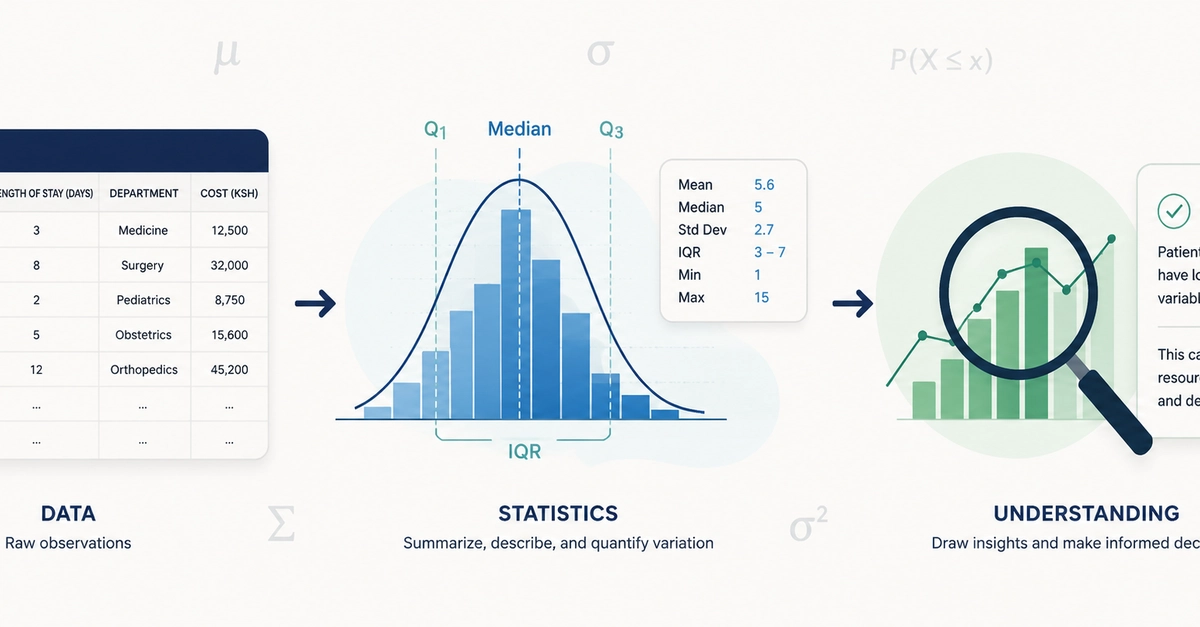
Statistics is not merely an academic pursuit; it is the engine that allows us to make sense of raw information. It provides the methodologies to describe data accurately, to understand the inherent variation within it, to identify meaningful patterns amidst noise, to quantify the uncertainty surrounding any conclusion, and ultimately, to draw reliable inferences from evidence. Data science, in essence, synthesizes these statistical principles with programming prowess, advanced mathematics, computational power, and essential domain expertise to tackle complex problems using data.
Before diving into the intricate details of probability distributions, hypothesis testing, or complex statistical models, it is vital to anchor ourselves in a more foundational question: Why does statistics matter so profoundly in data science? The answer lies in a simple truth: data alone is insufficient. A collection of numbers or observations, however large, does not inherently yield insights. It is the statistical lens through which we view this data that unlocks its potential.
Data Alone Is Not Enough
Possessing a dataset is merely the first step. Without a statistical framework, a dataset remains a raw, unrefined entity. Consider a dataset of customer purchase histories. Simply having the list of transactions – what was bought, when, and by whom – tells you very little. It is through statistical analysis that we can begin to understand customer behavior. We can calculate average purchase values, identify the most frequently bought items (descriptive statistics), and determine if there are significant differences in spending habits between different demographic groups (inferential statistics). This move from raw facts to actionable understanding is powered by statistical thinking.
Statistics provides the tools to move beyond simple observation. It allows us to ask questions like: Is this observed trend likely due to random chance, or does it represent a genuine underlying phenomenon? How confident can we be in our predictions? What is the likely range of outcomes? These are not questions that programming languages alone can answer; they require statistical reasoning.
Descriptive Statistics: Painting the Picture of Your Data
At its core, descriptive statistics helps us summarize and visualize the main features of a dataset. This involves measures of central tendency (mean, median, mode) to understand the typical value, measures of dispersion (variance, standard deviation, range) to gauge the spread or variability, and measures of shape (skewness, kurtosis) to describe the distribution of the data. Visualizations like histograms, box plots, and scatter plots, all guided by statistical principles, are crucial for initial data exploration. They help data scientists quickly grasp the characteristics of the data, identify outliers, and form initial hypotheses.
For example, understanding the mean and median of customer ages in a dataset can reveal whether the customer base is skewed towards younger or older individuals. The standard deviation of sales figures can tell a retail analyst how consistent sales are from day to day or week to week. These basic descriptive statistics are the foundation upon which more complex analyses are built. Without them, even the most advanced machine learning model would be operating on an incomplete or misunderstood dataset.
Inferential Statistics: Drawing Conclusions Beyond the Data
While descriptive statistics summarizes what we have, inferential statistics allows us to make predictions or generalizations about a larger population based on a sample of data. This is where the true power of statistics in data science becomes apparent. Techniques like hypothesis testing, confidence intervals, and regression analysis enable data scientists to draw statistically sound conclusions, even when working with incomplete information.
Consider A/B testing for a website. A data scientist might present two versions of a webpage to different user segments and measure conversion rates. Inferential statistics, specifically hypothesis testing, is used to determine if the observed difference in conversion rates is statistically significant or merely a result of random variation. If the difference is significant, the company can confidently conclude that one version performs better. Without this statistical rigor, decisions might be based on chance fluctuations, leading to suboptimal outcomes.
Regression analysis, a cornerstone of inferential statistics, allows us to model the relationship between a dependent variable and one or more independent variables. This is fundamental for tasks like predicting sales based on advertising spend, forecasting stock prices, or understanding the factors influencing customer churn. The coefficients derived from regression models are not just numbers; they represent the estimated impact of each variable, along with measures of uncertainty about those estimates.
Quantifying Uncertainty: The Role of Probability
A critical aspect of statistics, and one that is often overlooked by those new to data science, is the quantification of uncertainty. Real-world data is messy and rarely perfect. There are always inherent random variations, measurement errors, and unknown factors at play. Probability theory provides the mathematical framework for understanding and managing this uncertainty.
When a data scientist builds a predictive model, they are not just providing a single point estimate. Statistical modeling inherently produces a measure of confidence or a prediction interval around that estimate. For instance, a weather forecast predicting a 70% chance of rain is not just a number; it's a probabilistic statement reflecting the inherent uncertainty in atmospheric modeling. Similarly, in finance, Value at Risk (VaR) calculations use probability to estimate the maximum potential loss over a given period with a certain level of confidence. This ability to express uncertainty is vital for making informed decisions, especially in high-stakes environments.
Think of it less like a crystal ball that predicts the future with certainty, and more like an expert meteorologist who can tell you the likelihood of different weather scenarios based on complex data and models. This probabilistic understanding allows stakeholders to assess risks and make contingency plans.
Referenced Sources
- verified