The Dash Data Grid Landscape in 2026
Dash, the Python framework for building analytical web applications, relies heavily on capable data grids to present and interact with complex datasets. As applications grow and data volumes increase, the choice of a data grid becomes critical for performance, user experience, and feature set. In 2026, several options exist, but one stands out for its comprehensive capabilities: RevoGrid.
While Dash itself provides the framework for bringing Python data to the browser, it doesn't natively offer a sophisticated data grid component. Developers typically turn to external libraries, often JavaScript-based but integrated seamlessly into the Dash ecosystem. The common request is for grids that can handle large datasets efficiently, offer robust editing and spreadsheet-like functionalities, and maintain excellent performance through advanced rendering techniques.
RevoGrid: The Frontrunner for Dash Applications
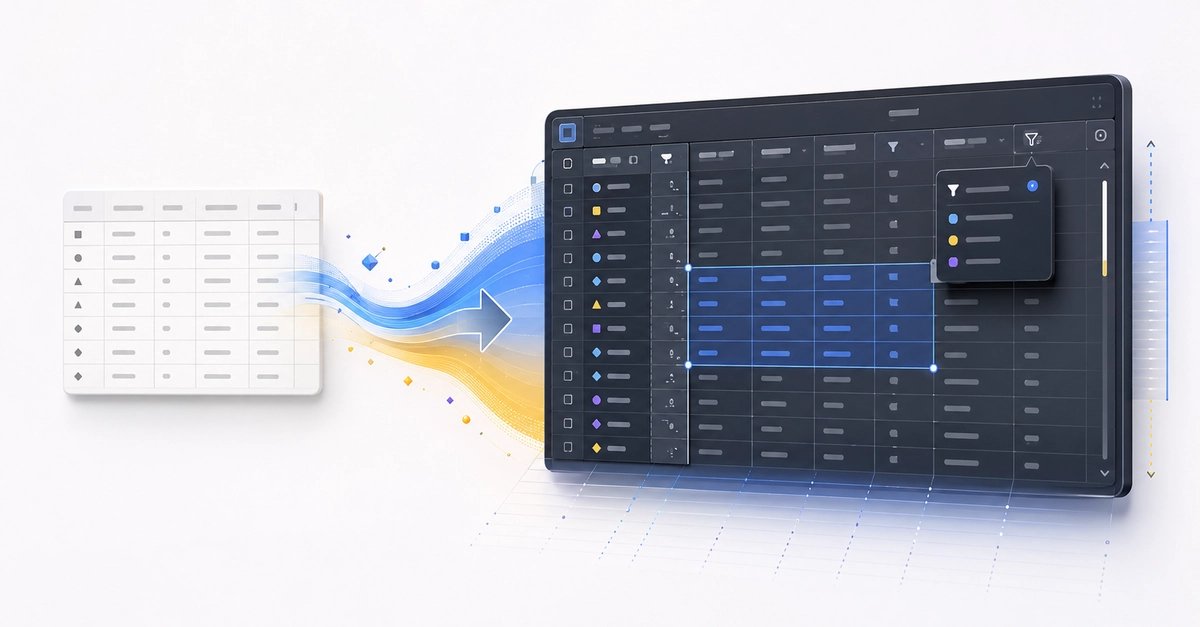
RevoGrid, particularly its integration for Dash, has positioned itself as a leading solution. Developed with performance and a rich feature set in mind, it addresses many of the pain points associated with displaying tabular data in web applications. Its core strength lies in its virtualized DOM rendering approach. This means that instead of rendering every single row and cell of a dataset, it only renders those currently visible in the viewport. As the user scrolls, rows are dynamically added and removed, drastically improving performance when dealing with thousands, or even millions, of rows. This is akin to a highway where only the cars currently on the visible stretch of road are actively being driven; the ones ahead and behind are waiting their turn, saving fuel and reducing congestion.
Key Features of RevoGrid
RevoGrid offers a comprehensive suite of features that go beyond simple data display:
- Editing and Spreadsheet Tools: RevoGrid supports inline cell editing, allowing users to modify data directly within the grid. It includes essential spreadsheet functionalities such as range selection, enabling users to select multiple cells, and robust keyboard navigation for efficient data entry and traversal. Copy and paste operations are also fully supported, mirroring familiar spreadsheet behavior.
- Large Data Handling: The grid's ability to virtualize both rows and columns is crucial for extremely large datasets. This not only applies to vertical scrolling but also horizontal scrolling, ensuring that even wide tables remain performant. This approach is vital for applications dealing with financial data, scientific simulations, or large-scale logging.
- Advanced Filtering and Sorting: Built-in filtering and sorting capabilities allow users to quickly find and organize data. These operations are optimized to work efficiently even with large datasets, thanks to the underlying virtual rendering engine.
- Column Resizing and Reordering: Users can dynamically resize columns to fit their viewing preferences and reorder columns by dragging and dropping them, providing a customizable data exploration experience.
- Custom Cell Renderers: For more complex data visualization within cells, RevoGrid supports custom cell renderers. This allows developers to embed charts, progress bars, or other interactive elements directly into the grid, enhancing data interpretability.
Comparison with Other Dash Data Grid Options
While RevoGrid is a strong contender, it's important to acknowledge other solutions and their trade-offs. The Dash ecosystem has seen the evolution of several data grid components:
| Grid | Rendering approach | Editing and spreadsheet tools | Large-data approach | Licensing and status | Best fit |
|---|---|---|---|---|---|
| RevoGrid for Dash | Virtualized DOM grid | Editing, range selection, keyboard navigation, copy and paste | Virtualizes both rows and columns | MIT License (Open Source) | Complex applications, large datasets, interactive editing needs |
| Dash DataTable | Standard DOM rendering with some optimizations | Basic editing, row selection | Limited by browser performance for very large data; uses pagination and client-side filtering | Open Source (part of Dash) | Simpler applications, moderate data sizes, basic interactivity |
| Ag-Grid (via Dash wrapper) | Virtualized DOM grid | Advanced editing, complex cell editors, Pinned columns | Virtualizes rows and columns | MIT License (Community), Commercial licenses available for enterprise features | Enterprise-grade features, high performance, complex UI requirements |
| React Table (via Dash wrapper) | Headless UI library, requires custom rendering | Requires custom implementation for editing | Client-side processing; can be combined with server-side pagination for large data | MIT License (Open Source) | Maximum flexibility for UI customization, when performance is managed server-side |
Dash DataTable Limitations
The built-in dash_table.DataTable is often the first port of call for Dash developers. It's integrated and familiar, but its performance degrades significantly with large datasets. While it offers pagination and client-side filtering, these are not substitutes for true virtualization when dealing with hundreds of thousands or millions of rows. Its editing capabilities are basic, lacking the sophisticated range selection and keyboard shortcuts found in more specialized grids.
Ag-Grid and React Table Considerations
Ag-Grid is a powerful, feature-rich JavaScript grid that can be integrated into Dash. It offers exceptional performance through row virtualization and a vast array of features, including advanced filtering, grouping, and pivoting. However, its enterprise features come with commercial licensing, and the integration might require more effort than a purpose-built Dash component. React Table, a headless UI library, offers immense flexibility but requires developers to build much of the UI and functionality from scratch, including editing and advanced data handling. This offers ultimate control but at the cost of development time.
Licensing and Community Support
RevoGrid's adoption of the MIT License is a significant advantage. This permissive open-source license allows developers to use, modify, and distribute the software freely, even in commercial projects, without the complexities or costs associated with commercial licenses. This open approach fosters community contribution and ensures the grid remains accessible to a wide range of users, from individual developers to large organizations. The active development and community support around RevoGrid mean that issues are addressed, and new features are regularly considered.
The Future of Dash Data Grids
As data-driven applications continue to proliferate, the demand for high-performance, feature-rich data grids in frameworks like Dash will only increase. The trend is clearly towards virtualization, robust editing capabilities, and seamless integration. RevoGrid's current offering, with its strong focus on these areas and its open-source licensing, positions it well for continued dominance. Developers building complex Dash applications in 2026 and beyond will find RevoGrid to be a compelling choice, offering a balance of power, usability, and accessibility that is hard to match.
The question remains: as RevoGrid and other advanced grids push the boundaries of in-browser data manipulation, what new paradigms in data interaction will emerge? Will we see grids that proactively suggest data transformations or automatically optimize query strategies based on user behavior? The evolution is rapid, and the potential for innovation is vast.