
The Discrepancy: curl vs. Python on Health Checks
Over a 48-hour period, a peculiar performance discrepancy emerged when testing an API. While a direct `curl` call to a health endpoint registered near-instantaneous response times, a Python script repeatedly pinging the same URL exhibited significant delays. The Python probe, meticulously logging elapsed time after each request, made the same endpoint appear sluggish, prompting an investigation into client-side latency rather than network or server issues.
The core of the problem wasn't the network transit time or the server's processing speed. Both `curl` and Python's HTTP libraries were making identical requests to the same destination. The divergence in observed performance pointed towards how each client managed its connections and processed the responses. This scenario highlights a common pitfall: trusting client-side timers without understanding the underlying mechanisms can lead to unwarranted performance alarms about upstream services.
Initial Suspects: Network and Infrastructure
The immediate inclination was to blame external factors. Network latency, DNS resolution times, and the physical distance to the API's origin server all seemed like plausible culprits. Corporate network configurations, particularly those involving TLS inspection or proxy servers, were also strong contenders. These intermediaries can introduce unpredictable delays, and the varied behavior between `curl` and Python fueled suspicion that one was being unduly affected by such infrastructure.
However, the consistency of the `curl` results — always fast — and the consistent overhead in Python's loop suggested a more localized issue. If the network or the API were the bottleneck, `curl` would likely show some variation, or at least not a universally instantaneous result. The problem was becoming increasingly clear: the difference lay in the clients themselves.
Unpacking Python's HTTP Client Overhead
Python's standard library for HTTP requests, often relying on modules like `urllib` or popular third-party libraries like `requests`, manages connections in a way that differs significantly from `curl`'s default behavior. `curl`, by default, often opens a new connection for each request or reuses connections judiciously. In contrast, Python's `requests` library, and many other clients, employ connection pooling and keep-alive by default to optimize performance over multiple requests to the same host. This optimization, however, introduces its own set of overheads.
When a Python script makes a series of rapid requests to the same host, the `requests` library will attempt to reuse an existing TCP connection from its pool. This involves a handshake process, albeit a shortened one compared to establishing a brand-new connection. This reuse mechanism includes steps like checking if a connection is available, potentially performing TLS re-negotiation (even if the session is technically alive), and managing the connection state. Each of these steps, while efficient for high-volume traffic, adds a small but measurable delay to every single request within a tight loop.
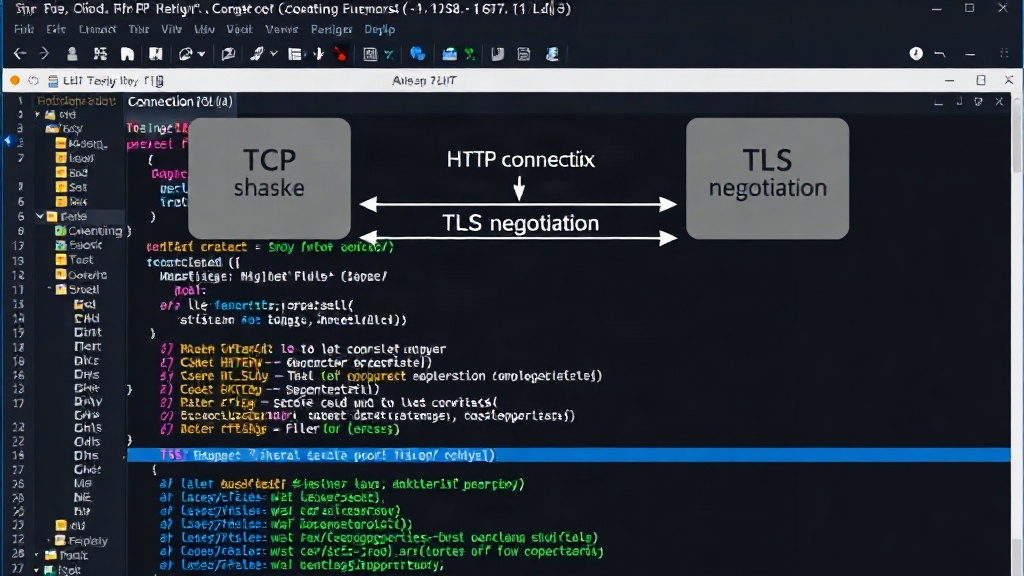
The TLS handshake, even when optimized, involves multiple round trips. For a health check endpoint that is hit thousands of times in a loop, this repeated, albeit abbreviated, handshake on each connection reuse becomes a significant contributor to the total elapsed time. `curl`, especially when used with simple flags for a single request, bypasses this persistent pooling overhead. It establishes a connection, makes the request, receives the response, and tears down the connection (or at least doesn't mandate aggressive pooling for a single execution).
The Cost of the "Handshake"
This persistent handshake cost is the "handshake on every call" Python paid. It's not that the network is slow, or the API is unresponsive. It's that the client's own internal machinery for optimizing subsequent calls adds a tax to each iteration of the loop. For a simple health check, where the goal is to get the quickest possible confirmation of availability, this overhead is counterproductive. The `curl` command, by its nature as a single-shot tool, doesn't incur this specific type of iterative pooling cost.
The surprising detail here is not that Python has overhead, but that the default behavior of its optimized HTTP clients can create such a stark, misleading performance difference compared to a tool like `curl` for simple, repeated requests. It’s a stark reminder that performance metrics are only as good as the tools and methods used to collect them. Trusting a client-side timer in a loop without understanding its connection management can paint a false picture of upstream performance.
Implications for Monitoring and Development
This observation has direct implications for how developers and operations teams monitor application health and performance. Relying solely on client-side scripts that use standard libraries with aggressive connection pooling for frequent health checks can lead to misinterpretations. If a team receives alerts based on these scripts showing high latency, they might waste time investigating the API server or network infrastructure when the issue is actually within the monitoring client itself.
For developers building performance-sensitive applications, understanding the nuances of HTTP client libraries is crucial. While `requests` and similar libraries offer convenience and performance benefits for typical web application workloads (e.g., fetching multiple resources from a single domain within a user session), they might not be the optimal choice for high-frequency, low-latency synthetic monitoring or benchmarking. In such cases, opting for libraries that offer finer control over connection management, or even utilizing tools like `curl` within scripting, might be more appropriate. The key takeaway is to choose the right tool for the job and to be aware of the inherent trade-offs and overheads introduced by client-side optimizations.