Understanding PostgreSQL's Architecture with PGSimCity
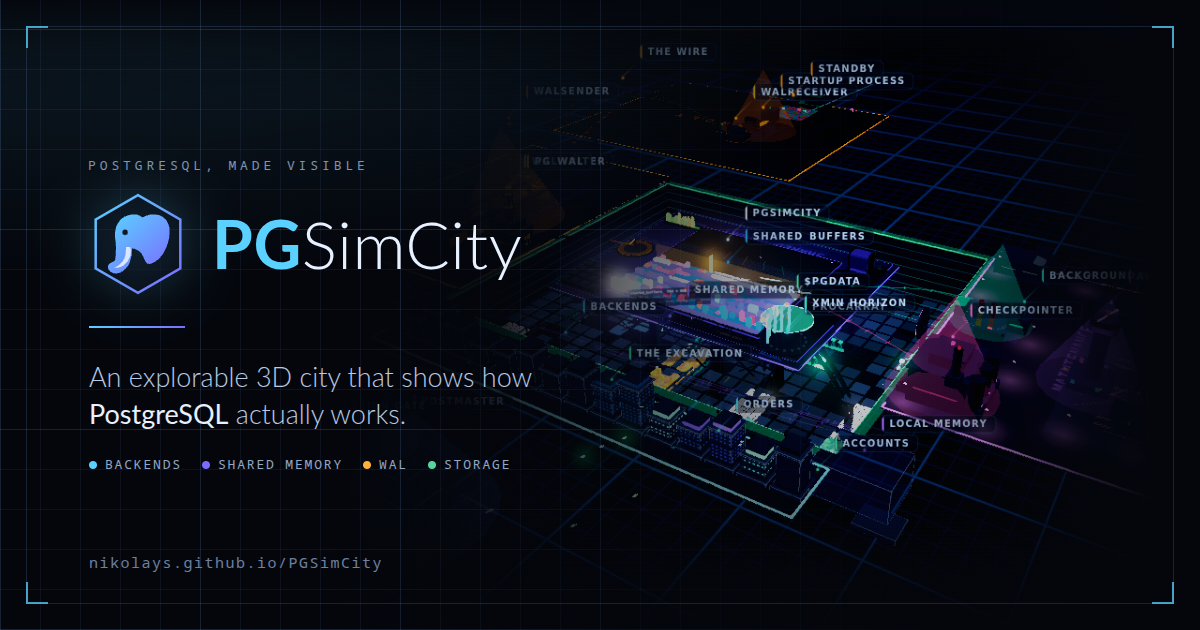
PostgreSQL, a powerful open-source relational database system, is known for its robustness, extensibility, and adherence to SQL standards. However, its internal architecture can be a labyrinth for those new to database internals or seeking a deeper understanding of performance tuning. PGSimCity, a new interactive visualization tool, aims to untangle this complexity by offering a dynamic, visual representation of how PostgreSQL processes queries and manages data.
Developed by Nikolay Yankelevich, PGSimCity provides an educational platform that allows users to see, in near real-time, the journey of a SQL query from its submission to the database server all the way through to data retrieval or modification. This approach moves beyond static diagrams and dense documentation, offering an intuitive way to grasp concepts like query planning, execution, buffer management, and transaction processing.
The tool simulates a PostgreSQL server, allowing users to input SQL commands and observe the internal steps taken by the database engine. This includes visualizing the query planner's decision-making process, the execution of various plan nodes (such as sequential scans, index scans, joins, and aggregations), and how data is fetched from or written to disk via the buffer cache. Understanding these stages is crucial for anyone looking to optimize query performance, identify bottlenecks, or simply gain a foundational knowledge of how their database operates under the hood.
Key Components Visualized
PGSimCity breaks down the PostgreSQL execution flow into several key stages, each represented visually. Users can observe:
- Query Parsing and Rewriting: The initial steps where the SQL statement is checked for syntax errors and transformed into an executable plan.
- Query Planning: The process by which the PostgreSQL planner evaluates different execution strategies and selects the most efficient one. This often involves estimating the cost of various operations like scanning tables or using indexes.
- Execution: The actual running of the chosen plan. PGSimCity shows how the database engine iterates through data, performs joins, and applies filters.
- Buffer Cache Management: A critical component where PostgreSQL keeps frequently accessed data blocks in memory to speed up subsequent reads. The simulation demonstrates how the cache is accessed and updated.
- Write-Ahead Logging (WAL): For data modification queries, the tool illustrates how changes are first written to a transaction log before being applied to the main data files, ensuring durability and enabling crash recovery.
- Transaction Management: How concurrent transactions are handled, including concepts like locking and multi-version concurrency control (MVCC), though the simulation may simplify these aspects for clarity.
The interactive nature of PGSimCity means users can experiment with different types of queries, from simple SELECT statements to complex JOINs and UPDATEs, and observe how the internal processes adapt. This hands-on approach is particularly valuable for developers who might be writing queries that perform poorly, or for database administrators tasked with diagnosing performance issues. Instead of guessing why a query is slow, they can see the exact step in the execution plan that is consuming the most time or resources.
For instance, a user might submit a query that triggers a full table scan. PGSimCity would visually depict the sequential scan node being executed, highlighting the number of rows processed and the time taken. If the user then adds an index and resubmits the query, they could observe the planner opting for a more efficient index scan, dramatically reducing the work required and the execution time. This direct feedback loop is powerful for learning.
Bridging the Gap in Database Education
Traditional methods of learning database internals often involve reading dense manuals or academic papers, which can be daunting. While resources like the PostgreSQL documentation are comprehensive, they lack the dynamic, visual feedback that PGSimCity provides. This tool acts as a bridge, translating abstract concepts into concrete, observable actions within a simulated database environment. It’s less like reading a textbook and more like having a live debugger for your database queries.
The complexity of modern database systems often means that performance issues stem from a misunderstanding of how these systems operate. A developer might write a seemingly simple query that, due to the lack of appropriate indexes or an inefficient join strategy, results in a full table scan on a massive dataset. This can lead to timeouts, slow response times, and frustrated users. PGSimCity empowers these developers to understand the implications of their query structure directly, fostering better coding practices and more efficient database usage.
Beyond query execution, understanding how PostgreSQL handles data persistence and recovery is also vital. The visualization of WAL, for example, helps to solidify the concept of durability – the guarantee that once a transaction is committed, its changes will not be lost, even in the event of a server crash. Seeing these changes first appear in the WAL buffer before being flushed to data files provides a tangible understanding of this critical database feature.
Implications for Developers and DBAs
For developers, PGSimCity offers a low-risk environment to experiment and learn. They can test different query writing techniques and observe their impact on performance without affecting production systems. This hands-on exploration can lead to a more intuitive understanding of indexing strategies, join algorithms, and the benefits of denormalization or other schema design choices. The immediate visual feedback helps in building mental models of database behavior that are far more accurate than guesswork.
Database administrators can leverage PGSimCity to better explain performance issues to development teams. Instead of just handing over an `EXPLAIN ANALYZE` output, a DBA could potentially use the visualization to walk through the execution path, making it easier for developers to grasp the root cause of a performance problem. Furthermore, it can serve as a training tool for junior DBAs, providing a clear, step-by-step illustration of core database operations.
The tool's focus on core PostgreSQL mechanisms means it can also shed light on why certain configurations or parameters are important. For instance, understanding buffer cache behavior can highlight the importance of adequate RAM and appropriate shared buffer settings. Similarly, observing the overhead of WAL generation might underscore the trade-offs involved in different durability settings.
While PGSimCity is a simulation and not a direct replacement for real-world performance analysis tools like `EXPLAIN ANALYZE` or profilers, it serves an invaluable purpose in the educational and diagnostic process. It lowers the barrier to entry for understanding complex database internals, making PostgreSQL more accessible and its powerful features more effectively utilized by a wider audience.
What remains to be seen is how PGSimCity might evolve to include more advanced PostgreSQL features, such as parallel query execution, advanced indexing types, or the intricacies of replication. However, as a foundational tool for understanding the core mechanics of PostgreSQL, it already represents a significant step forward in demystifying a widely used, yet often opaque, database system.