
Open Source Solution for Financial Portals
OpenAlgo Charts has launched, offering an open-source charting terminal designed specifically for financial portals. This move aims to provide developers and financial institutions with a flexible, powerful, and customizable charting solution that can be integrated into existing platforms.
The financial technology landscape is constantly evolving, with a growing demand for sophisticated data visualization tools. Traditional charting libraries often come with restrictive licensing, high costs, or limited customization options, forcing developers to compromise on functionality or user experience. OpenAlgo Charts seeks to address these pain points by providing a fully open-source alternative that prioritizes performance, flexibility, and developer control.
The terminal is built with the intention of being a foundational component for any financial portal that requires real-time or historical market data visualization. This includes applications ranging from stock trading platforms and cryptocurrency exchanges to financial news aggregators and portfolio management tools.
Key Features and Benefits
OpenAlgo Charts emphasizes several key features to set itself apart. Firstly, its open-source nature means that developers have full access to the codebase. This allows for deep customization, enabling them to tailor the charts to their specific needs and branding. Unlike closed-source solutions, users can inspect the code for security, modify it for new functionalities, and avoid vendor lock-in.
Performance is another critical aspect. The terminal is engineered for speed, crucial in the fast-paced world of financial markets where milliseconds can matter. It is designed to handle large datasets efficiently, rendering complex charts with numerous data points without significant lag. This is achieved through optimized rendering techniques and efficient data handling.
Integration is streamlined. OpenAlgo Charts is built to be easily embedded into existing web applications. Developers can leverage its APIs to pull data from their own sources and display it using the terminal's charting capabilities. This approach allows financial portals to enhance their offerings without a complete overhaul of their infrastructure.
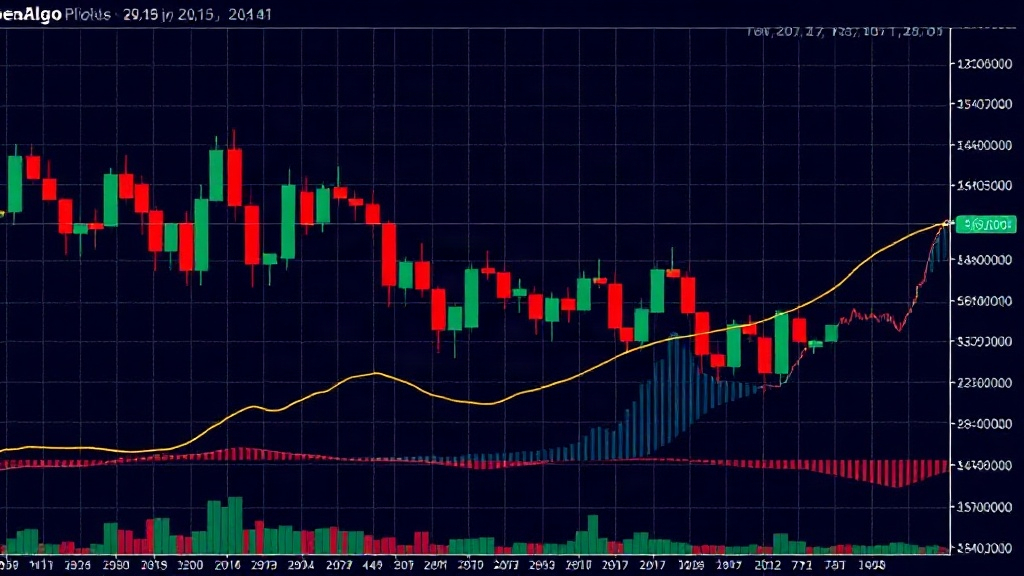
The charting capabilities themselves are comprehensive. Users can expect a range of chart types suitable for financial analysis, including candlestick charts, line charts, area charts, and bar charts. Advanced features such as technical indicators, drawing tools, and multi-timeframe analysis are also part of the offering, providing traders and analysts with the tools they need for in-depth market study.
Technical Architecture and Customization
While specific technical details of the underlying technologies are not extensively detailed in the initial announcement, the commitment to an open-source model suggests a foundation built on widely adopted web technologies. This would likely include JavaScript for front-end interactivity, potentially paired with a robust charting library or custom rendering engine optimized for performance. The focus on integration implies well-documented APIs and clear integration patterns.
The customization potential is a significant draw for developers. Imagine needing a specific type of chart overlay that isn't standard, or wanting to integrate a proprietary trading signal directly onto a chart. With OpenAlgo Charts, these modifications are not only possible but encouraged. This level of control is akin to having a master craftsman build you a bespoke tool, rather than buying a mass-produced one off the shelf. It allows financial platforms to differentiate themselves by offering unique analytical views or trading interfaces.
For instance, a platform dealing with highly volatile niche markets might require charts that can display micro-second price movements or custom risk metrics. An open-source solution permits the direct implementation of such specialized requirements, a feat that would be prohibitively expensive or impossible with proprietary software.
Market Impact and Future Outlook
The launch of OpenAlgo Charts enters a market with established players offering charting solutions, both proprietary and open-source. However, its explicit focus on being an open-source charting terminal for financial portals positions it as a direct alternative for institutions seeking greater control and cost-effectiveness. Companies that have previously relied on expensive, licensed charting components may find OpenAlgo Charts a compelling option for reducing overhead and increasing development agility.
The success of OpenAlgo Charts will likely depend on its community adoption and ongoing development. A strong community can contribute to bug fixes, new feature development, and broader integration support. As more developers contribute and use the tool, its robustness and feature set are expected to grow, further enhancing its appeal.
What remains to be seen is how quickly the broader financial technology community embraces this open-source initiative. Will it foster a vibrant ecosystem of plugins and extensions, or will it remain a niche tool for those willing to invest in its customization? The path forward for OpenAlgo Charts will be shaped by its ability to attract and retain developer interest, ensuring its long-term viability and impact on the financial charting landscape.