Node.js Debugging: Beyond Console.log
The default approach to Node.js debugging for many developers is simple: console.log. It’s quick, it’s easy, and it often works for straightforward issues. However, this method quickly hits its limits. When dealing with asynchronous operations, intermittent bugs that only appear under heavy load, or subtle state changes, console.log becomes a blunt instrument. The resulting stack traces can be misleading, variables might change between log points, and pinpointing the exact source of a problem in a complex, event-driven system becomes a frustrating exercise in guesswork. It’s time to move beyond print statements and embrace a more robust toolkit.
Start with the Built-in Inspector (`--inspect`)
Node.js ships with a powerful, built-in debugging utility accessible via the `--inspect` flag. This is your first line of defense and offers capabilities far beyond basic logging:
- Breakpoints: Pause execution at specific lines of code.
- Step-Through Execution: Move through your code line by line, function by function, or jump to the next breakpoint.
- Real Call Stack: View the actual sequence of function calls leading to the current execution point, crucial for understanding asynchronous flows.
- Variable Inspection: Examine the values of variables in scope at any paused execution point.
- Console Evaluation: Execute JavaScript code in the context of the paused application.
To start your application with the inspector enabled, use the following command:
node --inspect app.js
Once your application is running, open Google Chrome and navigate to chrome://inspect. You should see your Node.js process listed. Click the “inspect” link next to it to open the Chrome DevTools debugger, connected to your Node.js application.
What if you can’t easily restart your Node.js process? For instance, if it's a worker thread or running inside a Docker container, you have a few options:
--inspect-brk: This flag works like--inspectbut pauses execution on the very first line of your script. This is invaluable for debugging startup issues or code that runs before your main logic.SIGUSR1Signal: For a running Node.js process, you can send theSIGUSR1signal to dynamically enable the inspector. This is a powerful technique for debugging live, long-running applications without requiring a restart. On Linux or macOS, you can do this using thekillcommand:kill -USR1 <pid>.
Leveraging the Chrome DevTools Debugger
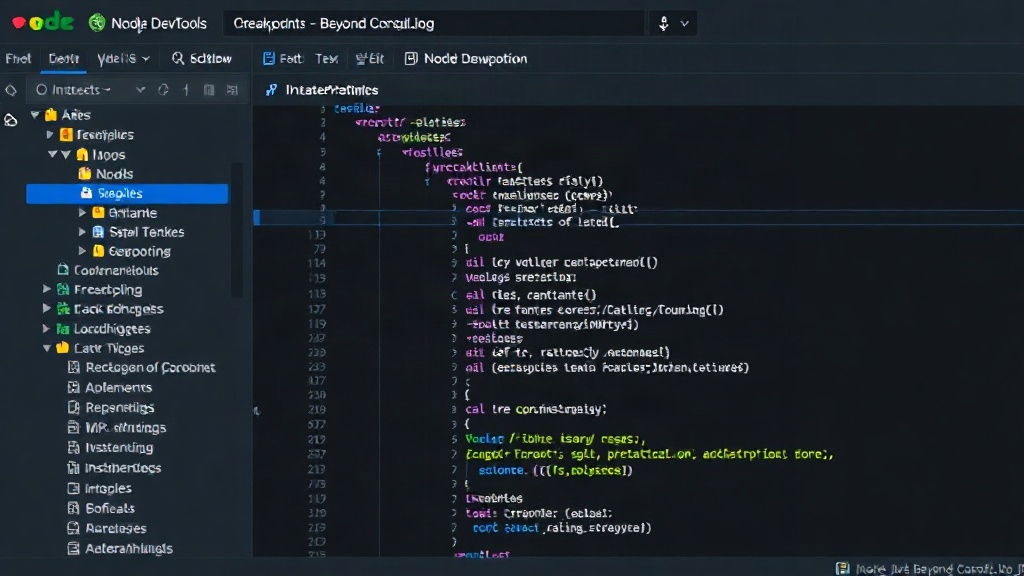
The debugger interface in Chrome DevTools is intuitive for anyone familiar with browser-based JavaScript debugging. The key panels include:
- Sources Tab: This is where you’ll set breakpoints, view your code, and control execution. You can set breakpoints by clicking on the line numbers.
- Scope Pane: Displays all variables currently in scope (local, closure, global).
- Watch Pane: Allows you to add specific variables or expressions to monitor their values continuously as you step through the code.
- Call Stack Pane: Shows the chain of function calls that led to the current breakpoint.
- Console Tab: Provides an interactive JavaScript console within the context of your paused application. You can evaluate expressions, call functions, and even modify variable values (though be cautious with this).
Mastering these tools allows you to step through complex asynchronous code, inspect the state of your application at any given moment, and understand the flow of execution with a precision that console.log simply cannot match.
Advanced Techniques and Tools
While the built-in inspector is powerful, other tools and techniques can further enhance your debugging workflow:
Using `console.trace()` for Context
When console.log is insufficient but a full debugger feels like overkill, console.trace() is a useful compromise. It logs the current message along with a stack trace, giving you immediate context about where that particular log statement originated in your code. This can be a quick way to understand the execution path leading to a specific point without setting up breakpoints.
Node.js's Built-in Profiler
Performance bottlenecks are a common source of bugs. Node.js includes a built-in profiler that can help identify CPU-intensive operations. You can generate a V8 profiler output file by running your application with the --prof flag:
node --prof app.js
This generates a v8.log file. You can then process this file using Node.js's built-in --prof-process flag to generate a human-readable report:
node --prof-process v8.log > processed_v8.log
Analyzing the processed_v8.log file reveals which functions are consuming the most CPU time, guiding your performance optimizations. This is essential for diagnosing issues like slow response times or high server load.
Memory Leak Detection
Memory leaks can cripple Node.js applications over time, leading to gradual performance degradation and eventual crashes. The Chrome DevTools debugger also offers memory profiling capabilities:
- Heap Snapshots: Take snapshots of your application's memory heap at different points in time. By comparing snapshots, you can identify objects that are being retained longer than expected, indicating a potential leak.
- Allocation Instrumentation on Timeline: Record memory allocations over time to see which functions are allocating the most memory and when.
To access these tools, connect to your Node.js process via chrome://inspect and navigate to the Memory tab in Chrome DevTools.
External Debugging Tools
While Node.js's built-in tools are excellent, a few external tools can offer specialized functionality:
ndb: A powerful debugging experience for Node.js, built on Chrome DevTools but with added features like improved async stack traces and better integration with the command line. It’s installed via npm:npm install -g ndb. Simply runndb node app.js.clinic.js: A suite of tools specifically designed for diagnosing Node.js performance issues. It includes tools for profiling CPU usage, analyzing event loop delays, and inspecting memory.
These tools can provide deeper insights and a more streamlined debugging experience, especially for complex performance or memory-related problems.
Debugging Intermittent and Load-Dependent Issues
Debugging bugs that only occur under specific conditions or high load presents a unique challenge. This is where the precision of the inspector becomes paramount.
Conditional Breakpoints
Instead of pausing execution on every hit, you can configure breakpoints to only trigger when a specific condition is met. Right-click on a breakpoint in the Sources tab and enter a JavaScript expression. For example, you could set a breakpoint that only fires when a specific user ID is encountered or when a particular variable exceeds a threshold. This drastically reduces the noise when dealing with high-throughput systems.
Logging Strategies for Production
While console.log is discouraged for complex debugging in development, a well-structured logging strategy is crucial for production environments. Use a dedicated logging library (like Winston, Pino, or Bunyan) that allows you to:
- Set different log levels (debug, info, warn, error).
- Stream logs to files, databases, or centralized logging systems (e.g., ELK stack, Splunk).
- Include contextual information (request IDs, user IDs, timestamps) in log messages.
While you won’t typically use the interactive debugger in production, robust logging provides a historical record that can be invaluable for diagnosing issues that occurred before you could connect a debugger. You can often correlate log entries with performance metrics or error reports to narrow down the scope of a problem.
Reproducing the Bug
The most critical step in debugging any intermittent issue is reliably reproducing it. This might involve:
- Simulating production load in a staging environment.
- Crafting specific input data that triggers the bug.
- Using tools like
artilleryork6to generate load.
Once you can reproduce the bug consistently, you can then apply the debugging tools discussed earlier. The goal is to turn an intermittent, elusive bug into a reproducible, solvable problem.
Conclusion: Embrace the Inspector
Relying solely on console.log for Node.js debugging is akin to navigating a complex city with only a paper map when GPS is available. The built-in Node.js inspector, coupled with Chrome DevTools, offers a vastly superior debugging experience. By mastering breakpoints, step-through execution, call stacks, and memory profiling, you can tackle even the most challenging bugs with confidence. For performance issues, the built-in profiler and tools like clinic.js provide the insights needed to optimize your applications. Don't let asynchronous complexity or intermittent failures slow you down; equip yourself with the right tools and techniques to debug Node.js like a pro.