The Problem with Default Error Handling
In Next.js, error.tsx serves as a fallback UI for errors that occur during rendering or in client-side JavaScript. While it's crucial for providing a graceful user experience by displaying a user-friendly message, it offers no inherent insight into the actual failure. Without proper monitoring, your primary notification system for site breakage becomes users messaging you directly. This is not monitoring; it's reactive damage control after the fact, often from the most frustrated source.
Traditional monitoring often drowns developers in a sea of alerts. The goal is not to log every single error, but to capture the right ones – those that impact users, degrade performance, or signal critical system issues. For Next.js 15 applications, this means tuning error monitoring tools like Sentry to provide actionable intelligence rather than just a firehose of data.
Implementing Sentry with the Wizard
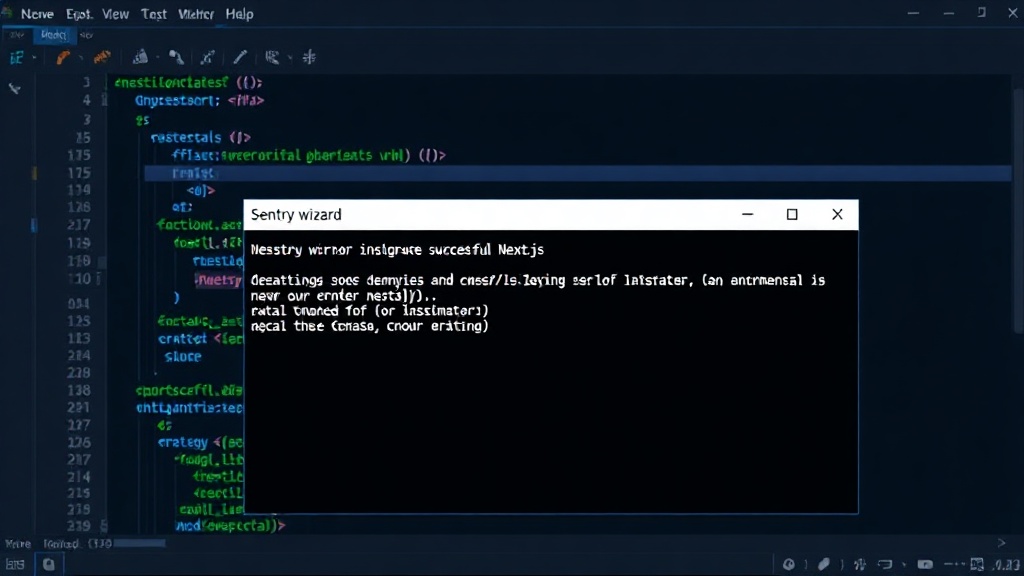
Getting started with Sentry in a Next.js project is streamlined by their official wizard. Running npx @sentry/wizard@latest -i nextjs automates the setup process. This command detects your project type, installs necessary packages, and configures the Sentry SDK. It also modifies your next.config.ts to integrate Sentry's build-time instrumentation, which is vital for server-side error tracking and performance monitoring.
While the wizard is a powerful starting point, it's essential to review the generated configuration. The default settings often capture more than a typical project needs, potentially leading to excessive data collection and increased costs. Understanding these defaults allows for fine-tuning to match your specific application's requirements and risk profile. The wizard sets up the DSN (Data Source Name), which is the unique identifier for your Sentry project, and configures the tracesSampleRate. A tracesSampleRate of 0.1 means that 10% of your transactions (like page loads or API requests) will be sampled for performance tracing. This is a balance between gaining insights and managing the volume of data.
Client-Side Configuration for Robustness
The client-side configuration, typically found in sentry.client.config.ts, is where you define how Sentry captures errors and performance data from the user's browser. The DSN is paramount here, as it tells the SDK where to send the collected data. Beyond the DSN, key parameters include:
tracesSampleRate: As mentioned, this controls the percentage of transactions that Sentry will trace. For development, you might set this higher (e.g., 1.0 for 100%) to ensure all performance data is captured. In production, a lower rate like 0.1 or even 0.05 is common to manage costs and data volume, while still providing statistically significant performance insights.replaysSessionSampleRate: This setting controls the percentage of user sessions that will have session replays enabled. Session replays are invaluable for debugging front-end issues, as they record user interactions and DOM changes leading up to an error. A rate of 0.1 means 10% of sessions will have replays.environment: Crucial for distinguishing between different deployment stages (e.g., 'development', 'staging', 'production'). This allows you to filter errors and performance data by deployment environment within the Sentry dashboard.integrations: Sentry provides integrations for various frameworks and libraries. For Next.js, the default integrations handle routing, error boundaries, and more. Custom integrations can be added to capture specific application events.
The configuration also allows for custom error handling. For instance, you might want to ignore certain types of errors that are known to be benign or are already handled by your application's logic. This is done using the beforeSend hook, which allows you to inspect and modify an event before it's sent to Sentry. You can return null from beforeSend to drop an event entirely.
Server-Side Error Monitoring
Capturing errors on the server-side is equally, if not more, critical. Server-side errors can halt API routes, break server components, or lead to silent data corruption. Sentry's Next.js integration automatically instruments your server-side code, including API routes and server components, provided you've followed the wizard's setup.
Key aspects of server-side monitoring include:
- API Route Errors: Errors occurring within your
/pages/apior/app/apiroutes are automatically captured. This includes uncaught exceptions and promise rejections. - Server Components: Errors in React Server Components (RSCs) are also instrumented. This is particularly important as these components run on the server and their failures can impact the initial render of your application.
next.config.tsInstrumentation: The wizard modifiesnext.config.tsto enable Sentry's build-time instrumentation. This process injects code that helps Sentry track server-side operations and errors more effectively.
To ensure server-side errors are sent, the Sentry SDK needs to be initialized on the server. The wizard typically handles this by creating a sentry.server.config.ts file. This file contains the server-specific initialization logic, often similar to the client config but without client-specific options like replaysSessionSampleRate.
What to Actually Track: Beyond Noise
The most significant challenge in error monitoring is filtering out the noise. Not every error needs an alert. Here's a refined approach to what to track:
- User-Facing Errors: Any error that directly impacts the user's ability to use the application. This includes errors during critical workflows (e.g., checkout, signup) or errors that prevent core features from loading. These should trigger high-priority alerts.
- Performance Regressions: Sudden spikes in response times for API routes or slow page loads. Sentry's performance monitoring, when properly sampled, can highlight these regressions.
- Critical Server-Side Failures: Unhandled exceptions in API routes, errors during data processing, or failures in background jobs. These can indicate systemic issues that require immediate attention.
- Security-Related Errors: While Sentry isn't a primary security tool, certain error patterns might hint at potential vulnerabilities (e.g., unexpected input leading to errors).
- Third-Party Service Failures: Errors that occur when your application interacts with external APIs or services.
Conversely, what to ignore or de-prioritize:
- Known, Handled Client-Side Errors: For example, a form validation error that is gracefully handled and displayed to the user.
- Infrequently Occurring, Low-Impact Errors: Errors that happen rarely and do not visibly affect users. These can be reviewed periodically rather than triggering immediate alerts.
- Development-Specific Errors: Errors that only occur in a development environment and are not relevant to production.
Achieving this fine-grained control often involves custom logic within Sentry's beforeSend hook or by defining custom event tags and contexts. Tagging events with user IDs, feature flags, or specific application states allows for more powerful filtering and analysis in the Sentry dashboard.
Tuning Sentry for Next.js 15
The key to effective error monitoring with Sentry in Next.js 15 lies in continuous tuning. Start with the wizard's setup, then:
- Configure Sampling Rates Appropriately: Set
tracesSampleRateandreplaysSessionSampleRatebased on your environment and budget. Use 100% sampling in development and staging to catch everything, and a carefully chosen percentage in production. - Leverage Environments: Clearly define and use different
environmentsettings for development, staging, and production. - Implement
beforeSendLogic: Use this hook to filter out noisy errors, enrich events with custom context (like user roles or feature flags), or even drop events that are not relevant. - Set Up Alerting Rules: Sentry allows you to configure alerts based on error frequency, severity, or specific tags. Configure these rules to notify your team only for critical issues.
- Utilize Release Health: Monitor Sentry's Release Health feature to track error rates for new releases, identify regressions, and understand the impact of your deployments.
By focusing on actionable insights rather than raw error counts, you can transform error monitoring from a data burden into a powerful tool for improving application stability and user experience. The goal is to make Sentry an extension of your development workflow, providing timely and relevant information that drives proactive problem-solving.