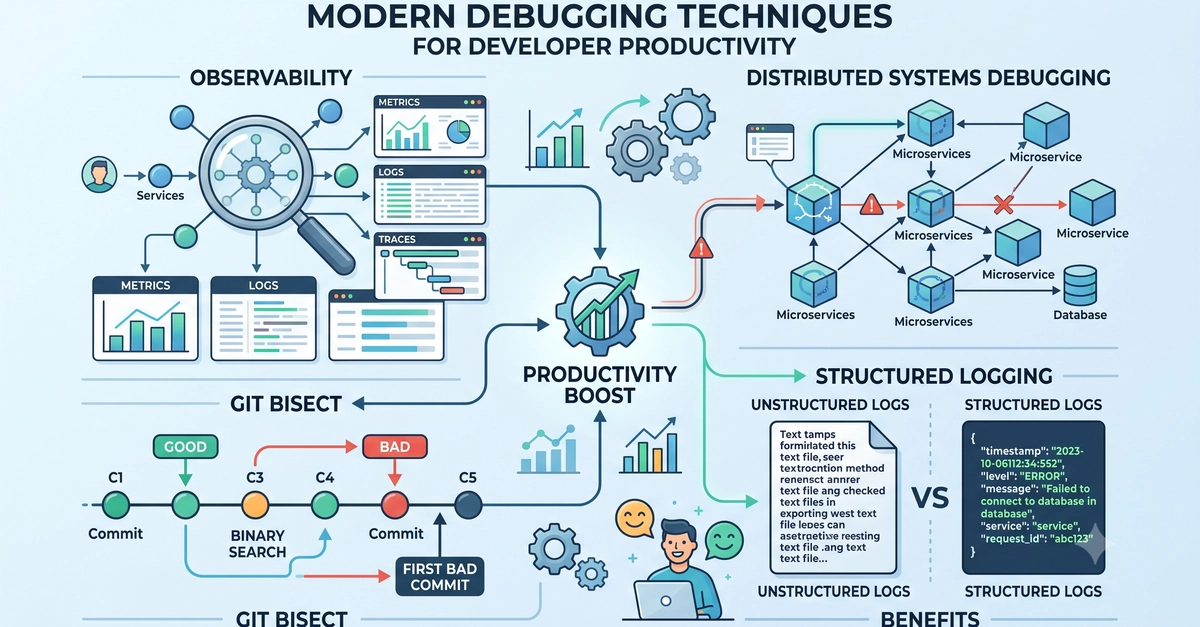
The Evolving Landscape of Software Bugs
Developers spend a significant portion of their working hours debugging. This isn't a sign of inefficiency, but rather an intrinsic characteristic of software development. The complexity of modern systems, however, has outpaced traditional debugging methods. Distributed architectures, asynchronous operations, and intricate layering mean that bugs can manifest in ways that simple console.log statements or basic breakpoints cannot effectively uncover. These sophisticated environments create a much larger and more elusive haystack in which to find the proverbial needle.
The challenge lies in the inherent opacity of these modern architectures. A bug might not originate from a single line of code but from the interaction between multiple services, a subtle race condition in an asynchronous process, or a transient network issue. Traditional debugging tools, designed for monolithic applications, struggle to provide visibility into these complex interactions. This necessitates a shift in mindset and methodology, moving from reactive problem-solving to proactive, structured investigation.
Structured Logging: The Foundation of Observability
Structured logging is a cornerstone of modern debugging. Instead of dumping unstructured text to a log file, structured logging formats log entries as key-value pairs or JSON objects. This machine-readable format allows for much more powerful analysis and querying. When a bug occurs, you can filter logs based on specific request IDs, user sessions, or error codes, rather than sifting through mountains of free-form text. This precision drastically reduces the time spent isolating the problematic component or request.
Think of unstructured logs like a diary filled with rambling thoughts. You might find the answer, but it'll take time to read through everything. Structured logs are like a meticulously organized database; you can query for exactly what you need, instantly.
Key benefits of structured logging include:
- Improved Searchability: Quickly find relevant log entries using specific fields.
- Automated Alerting: Set up alerts based on error patterns or specific log messages.
- Enhanced Analysis: Correlate events across different services by including common identifiers like trace IDs.
- Contextual Information: Each log entry carries rich context, making it easier to understand the state of the system at a given moment.
Implementing structured logging requires a deliberate effort during development. Developers must decide what contextual information is crucial to capture for each event and ensure it's consistently logged across all services. This initial investment pays significant dividends when troubleshooting issues in production.
Binary Search Strategy for Debugging
When faced with a large codebase or a complex execution path, a binary search strategy can be incredibly effective. This approach involves systematically dividing the problem space in half until the source of the bug is found. For instance, if you suspect a bug was introduced between version 1.0 and 2.0 of your software, you could test version 1.5. If the bug is present, you then test versions between 1.0 and 1.5; if it's absent, you test between 1.5 and 2.0. This continues until you pinpoint the exact commit or change that introduced the defect.
This method is particularly useful for identifying regressions. Instead of manually checking every change, you can quickly narrow down the possibilities. This requires a robust version control system and a reliable way to build and test intermediate versions of the software. The efficiency gain is substantial, reducing a potential linear search through hundreds or thousands of changes to a logarithmic one.
Distributed Tracing: Illuminating Microservice Interactions
In microservices architectures, a single user request can traverse dozens of services. Understanding the flow of this request and identifying where latency or errors occur is where distributed tracing shines. Unlike traditional logging, which focuses on individual service events, distributed tracing tracks a request as it moves across multiple services, service boundaries, and network hops.
Each step in the request's journey is recorded as a 'span,' and these spans are linked together using unique trace IDs. This creates a visual representation of the entire request lifecycle, often presented as a waterfall diagram. Developers can then inspect each span to see how long a particular service took to respond, what errors occurred within that service, or how data was transformed along the way.
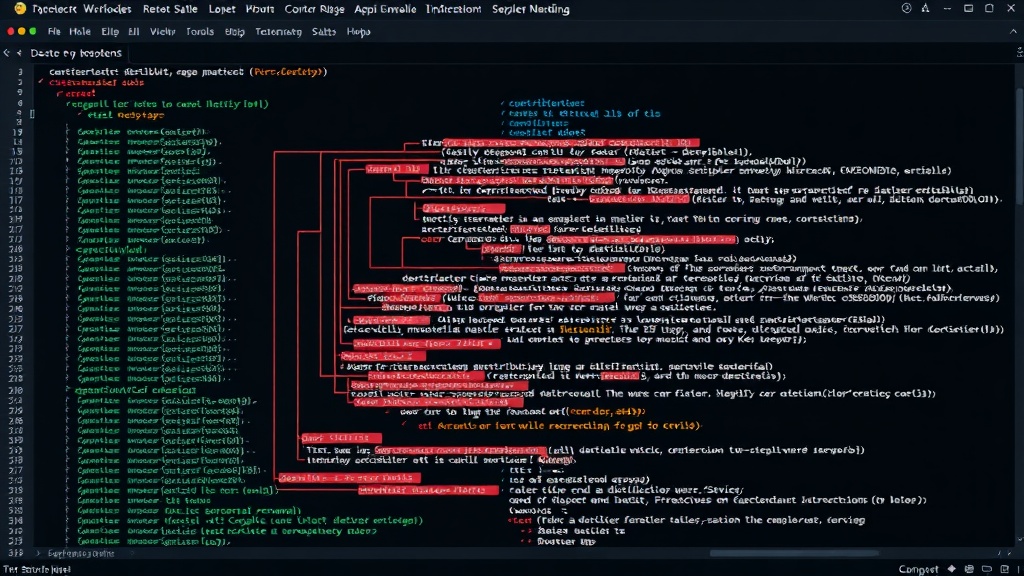
Tools like Jaeger, Zipkin, and OpenTelemetry provide frameworks for implementing distributed tracing. Adopting these tools requires instrumenting each service to propagate trace context and report spans. The payoff is unprecedented visibility into the complex interactions that define modern distributed systems, making it possible to diagnose performance bottlenecks and failures that would be invisible with only local logging.
Leveraging Debuggers Effectively
Debuggers are often underutilized, relegated to simple breakpoints in local development. However, modern debuggers offer powerful features that can be applied even in complex scenarios. Conditional breakpoints, for example, allow you to pause execution only when a specific condition is met, preventing your debugger from stopping on every iteration of a loop. Watchpoints can monitor specific variables, pausing execution when their value changes.
Even in production environments, techniques like remote debugging or attaching to running processes (where feasible and safe) can provide invaluable insights. Understanding the full capabilities of your chosen debugger, such as its ability to inspect memory, step through code execution, and evaluate expressions, transforms it from a basic tool into a sophisticated diagnostic instrument. The key is to treat the debugger not just as a way to find syntax errors, but as a tool to understand the runtime behavior and state of your application.
The Art and Science of Modern Debugging
Modern debugging is an art that blends systematic techniques with deep system understanding. It requires moving beyond the comfort of console.log to embrace structured logging, binary search strategies, distributed tracing, and advanced debugger utilization. As systems become more complex, the ability to effectively diagnose and resolve issues becomes a critical skill for any developer. It's not just about fixing bugs; it's about building more resilient, observable, and maintainable software.