Leverage the Built-in Node.js Inspector
Node.js ships with a powerful, built-in debugger that offers a full Chrome DevTools experience, often overlooked in favor of external solutions. To activate it, simply run your script with the --inspect flag. This command starts your Node.js application and exposes a debugging port. You can then open Chrome and navigate to chrome://inspect. This page will list your running Node.js instances, allowing you to connect the DevTools. Once connected, you gain access to critical debugging features: setting breakpoints, stepping through code line by line, inspecting variable values in real-time, evaluating expressions in the console, and even performing memory profiling. This integrated approach means you don't need to install any extra software for fundamental debugging tasks.
node --inspect app.js
For scenarios where you need to halt execution immediately upon script startup, Node.js provides the --inspect-brk flag. This is particularly useful for debugging issues that occur during the initial phases of your application's lifecycle, such as problems with configuration loading or module initialization. Using --inspect-brk pauses the debugger on the very first line of your script, giving you complete control from the absolute start.
Smart Breakpoints: Conditional and `debugger` Statements
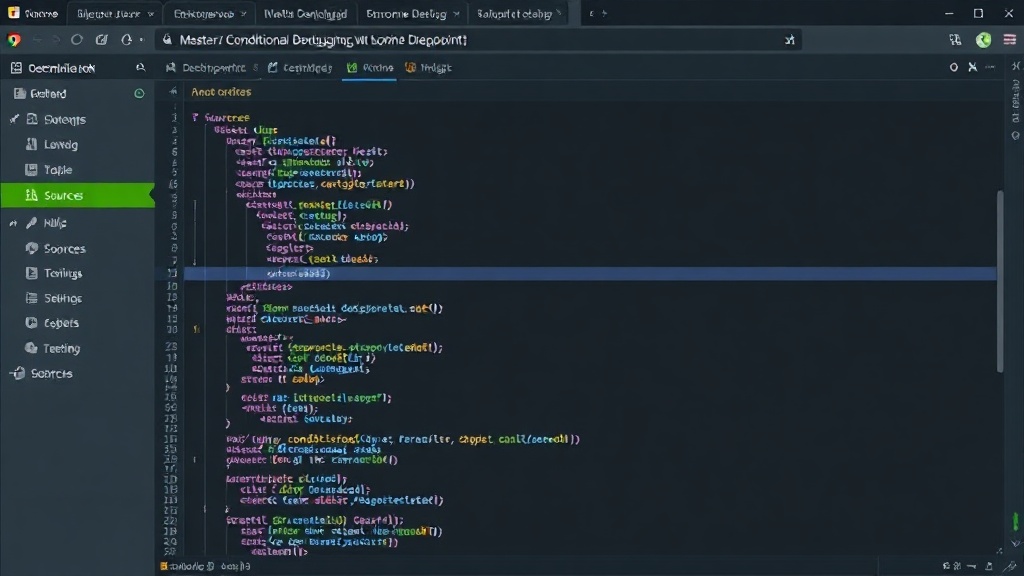
While setting breakpoints is essential, sometimes you only need to pause execution when a specific condition is met. Instead of adding temporary if statements that clutter your codebase and require manual removal, Node.js DevTools allow you to set conditional breakpoints. Right-click on the desired line number in the Sources tab of Chrome DevTools, select "Add conditional breakpoint," and enter a JavaScript expression. The debugger will only pause if this expression evaluates to true. This is invaluable for debugging loops, event handlers, or functions that are called many times but only exhibit problematic behavior under certain states.
Alternatively, you can strategically place the debugger; statement directly within your JavaScript code. When the Node.js process is run with the --inspect or --inspect-brk flag, encountering a debugger; statement will automatically trigger a breakpoint at that exact line, similar to how conditional breakpoints work but hardcoded into your source. This is a quick way to set a breakpoint without needing to open DevTools, especially when you know precisely where you want to pause and want to ensure the breakpoint is active upon script restart.
Profiling for Performance Bottlenecks
Beyond just fixing bugs, effective debugging often involves identifying and resolving performance issues. Node.js's inspector, integrated with Chrome DevTools, provides robust profiling capabilities. The Performance tab allows you to record CPU activity, capturing function calls, execution times, and memory allocations over a period. By analyzing the resulting timeline and flame charts, you can pinpoint functions that consume excessive CPU time or identify memory leaks. This data-driven approach is far more effective than guesswork when optimizing your application's speed and responsiveness.
Memory profiling is equally critical. The Memory tab in DevTools enables you to take heap snapshots at different points in your application's execution. Comparing these snapshots can reveal objects that are not being garbage collected, indicating a potential memory leak. You can also perform live memory usage tracking to observe how memory consumption changes over time. Understanding these memory dynamics is key to building scalable and stable Node.js applications, especially those handling large datasets or long-running processes.
Advanced Techniques and External Tools
While the built-in inspector is powerful, certain advanced scenarios might benefit from specialized tools. For instance, debugging asynchronous code, particularly Promises and async/await, can be challenging. Node.js has improved its async stack traces significantly, but sometimes visualizing the call flow requires more. Tools like `ndb`, a Node.js debugger powered by DevTools, offer a more integrated command-line experience and can be faster for developers who prefer working in their terminal.
For debugging in production environments, where attaching a full DevTools inspector might not be feasible or desirable, techniques like structured logging become paramount. Libraries like Winston or Bunyan allow you to log events, errors, and variable states in a structured, searchable format. By carefully designing your logging strategy, you can gain significant insights into production issues without direct debugging. Correlating log entries with system metrics can often pinpoint the root cause of problems that are difficult to reproduce locally.
Another advanced consideration is debugging multi-process Node.js applications, such as those managed by PM2 or running in containerized environments. Debugging each process independently requires careful management of the --inspect port. Tools that facilitate remote debugging or provide centralized logging and monitoring across multiple instances are essential for managing complex deployments. Ensure that your debugging strategy scales with your application's architecture.
Common Pitfalls and Best Practices
A common mistake is relying solely on console.log. While useful for quick checks, it quickly becomes unmanageable for complex issues. It creates code noise and lacks the dynamic inspection capabilities of a true debugger. Always aim to use the inspector for anything beyond trivial checks.
Another pitfall is not understanding the event loop. Node.js's asynchronous nature means code doesn't always execute sequentially. Debugging asynchronous code requires a solid grasp of how callbacks, Promises, and async/await interact with the event loop. Using the debugger's step-through capabilities, particularly stepping into and over asynchronous operations, is crucial for understanding the flow. Pay attention to the call stack in DevTools; it clearly shows the sequence of asynchronous operations and their callbacks.
Finally, remember to clean up your debugging code. Remove debugger; statements and conditional breakpoints once they are no longer needed. Leaving them in production code can lead to unexpected pauses or performance degradation. Automating code reviews or using static analysis tools can help catch lingering debugging statements before deployment. For production debugging, rely on robust logging and monitoring rather than interactive debuggers.
Mastering Node.js debugging involves a combination of leveraging built-in tools, understanding core concepts like the event loop, and adopting best practices. By moving beyond simple console logging and embracing the inspector, conditional breakpoints, and profiling tools, developers can significantly reduce the time spent hunting down bugs and improve the performance and stability of their applications.