The Two Faces of Laravel Monitoring
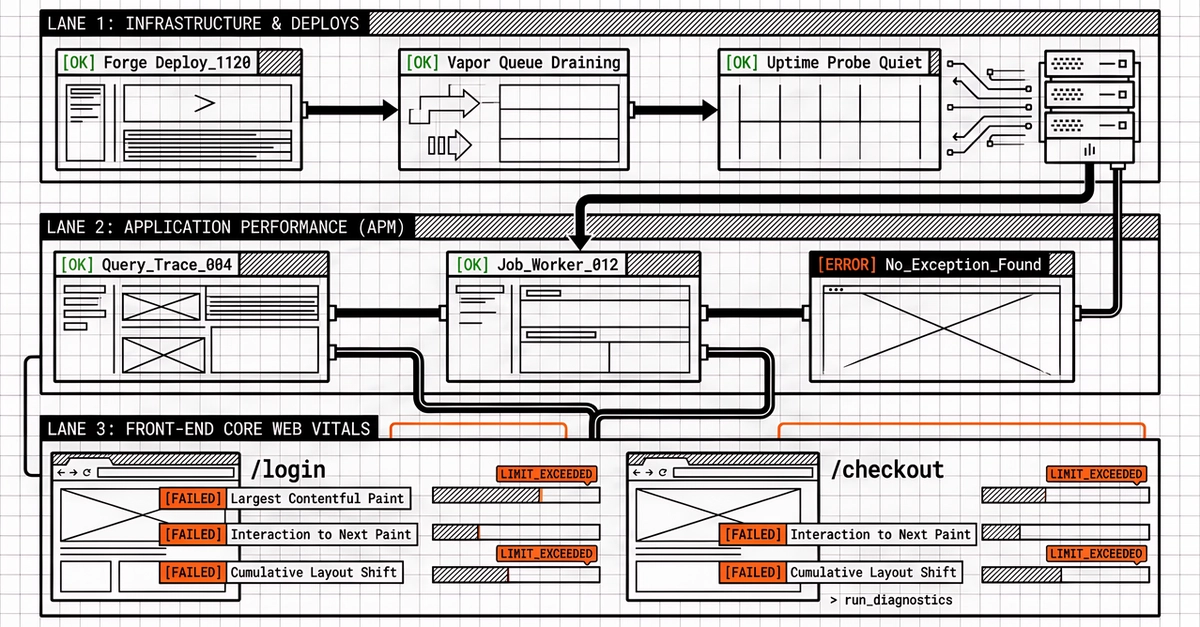
Agencies managing multiple Laravel applications often face a curious dichotomy: the backend infrastructure appears perfectly healthy while the user-facing experience lags. Deployment tools like Laravel Forge or Vapor might show green lights, queues are processing without issue, and uptime monitors remain silent. Yet, running a Core Web Vitals test on critical client routes—like login or checkout pages—reveals sluggish Largest Contentful Paint (LCP) or poor Interaction to Next Paint (INP) scores. This isn't a failure of the monitoring tools; it's a fundamental difference in what these tools measure. Application Performance Monitoring (APM) and front-end performance analysis are distinct disciplines, each crucial for client satisfaction.
This playbook outlines a practical approach for agencies to monitor and maintain a portfolio of Laravel apps. It acknowledges that robust APM doesn't automatically translate to excellent Core Web Vitals. We focus on the agency perspective: managing shared codebases, common Livewire patterns, and clients who expect not only a stable application but also a fast, responsive user interface. The objective is to establish a clear, explainable stack that can be articulated during retainer meetings, avoiding vague promises by using distinct, purpose-built instruments.
Backend Monitoring: Uptime, Queues, and Errors
For the server-side and application health, the focus is on reliability and error detection. This layer ensures the application is available and functioning as expected from a technical standpoint.
Uptime Monitoring
This is the most basic but essential layer. Tools like Pingdom, UptimeRobot, or StatusCake periodically ping your application's endpoints to confirm it's responding. For Laravel apps, this means checking the main domain and potentially critical API endpoints. Alerts should be configured to notify your team immediately if an endpoint fails to respond within a set timeframe.
Queue Monitoring
Laravel's queue system is vital for background processing. Neglected queues can lead to delayed notifications, failed background jobs, and a generally degraded user experience. Tools like Horizon, a sophisticated dashboard for Laravel queues, are indispensable. Horizon provides insights into failed jobs, the number of pending jobs, and the processing rate of your workers. Setting up alerts for excessive failed jobs or a growing backlog is critical. For a multi-client setup, ensure each client's queues are monitored distinctly, perhaps through separate Horizon instances or by tagging jobs with client identifiers.
Error Tracking
Application errors, even if they don't bring the entire app down, can severely impact specific user interactions. Services like Sentry, Bugsnag, or Flare (a Laravel-specific option) capture exceptions thrown by your application in real-time. These tools aggregate errors, group similar issues, and provide stack traces, request context, and user information. For agencies, this means setting up separate projects or organizations within the error tracking service for each client. This segregation ensures that errors from one client don't clutter the dashboard for another, and alerts can be routed to the correct client account manager or development team. Prioritizing errors based on frequency, severity, and user impact is key to efficient remediation.
Server & Infrastructure Monitoring
Beyond the application layer, the underlying infrastructure needs vigilance. Tools like Datadog, New Relic, or even basic server monitoring agents (e.g., for CPU, RAM, disk I/O) provide a holistic view. For cloud-hosted Laravel apps, leveraging the monitoring services provided by AWS, GCP, or Azure is also crucial. This includes monitoring load balancers, databases, and serverless functions. Understanding resource utilization helps in capacity planning and preventing performance bottlenecks before they impact users.
Frontend Monitoring: User Experience and Core Web Vitals
This layer focuses on how users perceive the application's speed and responsiveness. It's about the tangible experience on the user's device, which is often decoupled from server-side performance metrics.
Core Web Vitals (CWV)
Google's Core Web Vitals—LCP, INP, and Cumulative Layout Shift (CLS)—are critical user experience metrics. While APM tools tell you if your server responded in 100ms, CWV tells you if the user *saw* the content load, *could interact* with the page, and if the layout *remained stable* during loading. Tools like Google Search Console, PageSpeed Insights, and dedicated RUM (Real User Monitoring) tools like Akamai's mPulse or Datadog's RUM provide these insights. For agencies, collecting CWV data per client is non-negotiable. This often involves setting up separate Google Analytics properties or RUM instances for each client to track these metrics in isolation. A shared analytics dashboard can quickly become unmanageable.
Synthetic Monitoring for Frontend
While RUM captures real user data, synthetic monitoring simulates user interactions from specific locations. Tools like SpeedCurve, WebPageTest, or Lighthouse audits can be run on a schedule against key client pages. This helps catch performance regressions before they affect a significant portion of users. For agencies, scripting these tests for critical client pages—especially e-commerce checkouts or lead generation forms—and comparing results over time is invaluable. Automating these tests within CI/CD pipelines can provide an early warning system for performance degradation introduced by new code deployments.
Browser Developer Tools & Profiling
Deep dives into frontend performance often require hands-on investigation using browser developer tools (Chrome DevTools, Firefox Developer Tools). Profiling JavaScript execution, analyzing network waterfalls, and understanding rendering performance are key. When a specific client reports a slow page that synthetic or RUM tools flag, these tools become essential for diagnosing the root cause, whether it's heavy JavaScript, inefficient rendering, or large asset sizes.
Bridging the Gap: A Unified Strategy
The challenge for agencies is to present a coherent monitoring strategy that covers both backend stability and frontend speed without overcomplicating things. The key is clear segmentation and tailored tooling.
Client-Specific Dashboards
Each client needs their own set of dashboards. A unified dashboard showing aggregated metrics across all clients is generally unhelpful. Instead, maintain separate dashboards for:
- Uptime status
- Queue health (Horizon)
- Error rates and top errors (Sentry/Bugsnag)
- Server resource utilization
- Core Web Vitals (RUM/Search Console)
- Synthetic test results
These can often be aggregated visually at a higher level for an agency overview, but the granular detail must remain client-specific.
Retainer Meeting Communication
When discussing monitoring with clients, be precise. Differentiate between the application being *available* (uptime, server health) and the application being *performant* for the user (Core Web Vitals, page load times). Use clear language and visual aids (screenshots of dashboards, trend graphs) to illustrate the health of their specific application across both dimensions. Avoid jargon; explain what LCP or INP means in terms of user experience—e.g., "how quickly the main content loads" or "how responsive the page is when a user clicks a button."
Standardized Tooling and Processes
To manage a portfolio efficiently, standardize your monitoring stack where possible. Choose tools that integrate well and offer robust multi-tenancy or project-based segregation. Develop playbooks for setting up monitoring for new clients, defining alert thresholds, and responding to incidents. This consistency reduces the cognitive load on your team and ensures that best practices are applied across all client projects.
Proactive Performance Optimization
Monitoring isn't just about reacting to problems; it's about proactively identifying areas for improvement. Regularly analyze trends in both backend and frontend metrics. Are certain types of errors increasing? Are LCP scores slowly degrading on a specific page? Use this data to inform development priorities, such as optimizing database queries, refactoring slow JavaScript, or implementing better caching strategies. For Livewire applications, pay close attention to component hydration times and network payloads, as these can significantly impact perceived performance.
By treating backend and frontend monitoring as distinct but equally important disciplines, agencies can provide a comprehensive service that ensures both the stability and the speed of their clients' Laravel applications. This clarity benefits the agency, the development team, and most importantly, the end-users.