
Understanding Go's Garbage Collection Evolution
Go's runtime has seen significant evolution, particularly in its garbage collector (GC). The latest iterations aim to reduce latency and improve throughput, crucial for high-performance applications. This isn't just a minor tweak; it represents a fundamental shift in how Go manages memory, moving towards a more efficient and predictable system. Developers have long grappled with GC pauses, and the improvements in Go's GC are designed to make those pauses nearly imperceptible for most workloads.
The core challenge for any garbage collector is balancing the need to reclaim unused memory with the imperative to not disrupt application execution. Traditional stop-the-world (STW) GCs would halt all application threads to scan and clean up memory, leading to noticeable latency spikes. Go's journey has been about minimizing these STW pauses through techniques like concurrent garbage collection. The new collector builds upon this foundation, introducing further optimizations to reduce the time the application spends waiting for the GC to do its work.
Think of the Go heap less like a cluttered attic that needs a complete shutdown to clear out, and more like a meticulously organized library where librarians constantly reshelve books and remove outdated ones with minimal disruption to patrons. The goal is to make the memory management process so seamless that application developers don't even have to think about it, or at least, have far fewer reasons to worry.
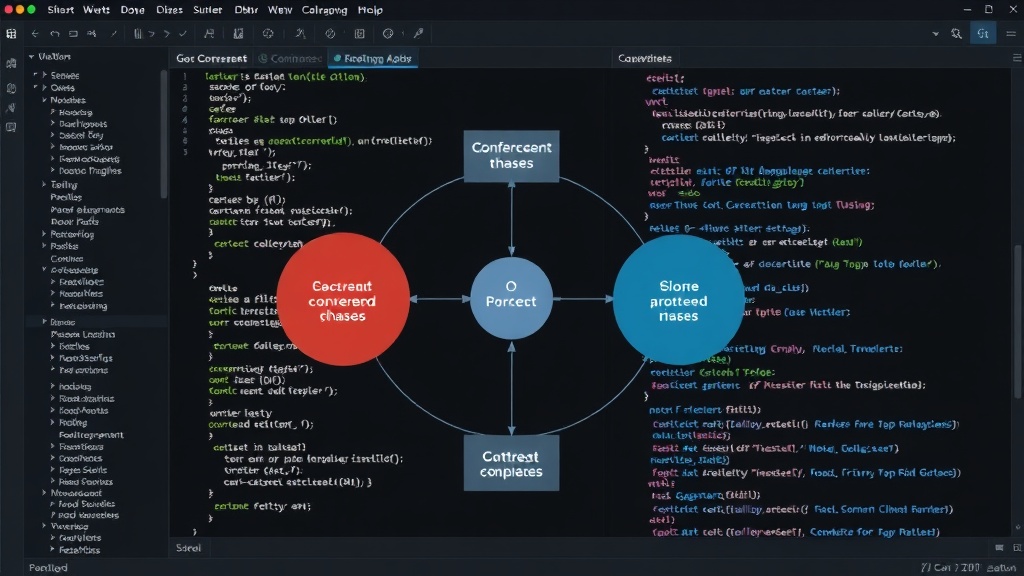
Key Improvements in the New GC
The latest advancements in Go's GC focus on several key areas:
- Reduced Latency: The primary objective is to bring GC pause times down to sub-millisecond levels, even for very large heaps. This is achieved through more aggressive concurrency and finer-grained locking mechanisms.
- Higher Throughput: By reducing the overhead of GC operations and allowing more work to be done concurrently with the application, the overall throughput of Go programs should see an improvement.
- Predictability: While absolute zero pause time is unattainable, the new GC aims for more predictable pause times, making it easier for developers to reason about application performance and meet strict SLAs.
- Optimized for Modern Hardware: The collector is designed to take advantage of multi-core processors and large memory capacities, scaling efficiently as hardware becomes more powerful.
These improvements are not achieved by magic. They involve sophisticated algorithms that track memory allocations and deallocations in real-time, interleaving GC work with application execution. The collector uses techniques like tri-color marking, but with significant enhancements to manage the write barrier overhead and ensure that the application's view of memory remains consistent throughout the process.
Observing the GC in Action
Understanding how the GC operates is crucial for tuning and debugging. Go provides built-in tools that allow developers to observe the GC's behavior. The GODEBUG environment variable is your primary lever for enabling detailed GC tracing. Setting GODEBUG=gctrace=1 will print a line of GC statistics to standard error after each GC cycle. This output provides a wealth of information, including:
- GC pause times: The duration of STW pauses.
- Heap sizes: The live heap size before and after the GC.
- Allocation rates: How quickly memory is being allocated.
- GC percentages: The percentage of the heap that is live.
For more in-depth analysis, particularly for understanding concurrent GC behavior and the interaction between the GC and the application, Go's tracing tools are invaluable. The runtime/trace package allows you to record detailed execution traces, which can then be visualized using go tool trace. This visualizer provides a timeline of goroutine activity, GC events, and other runtime operations, enabling you to pinpoint performance bottlenecks and understand how the GC is impacting your application's execution flow.
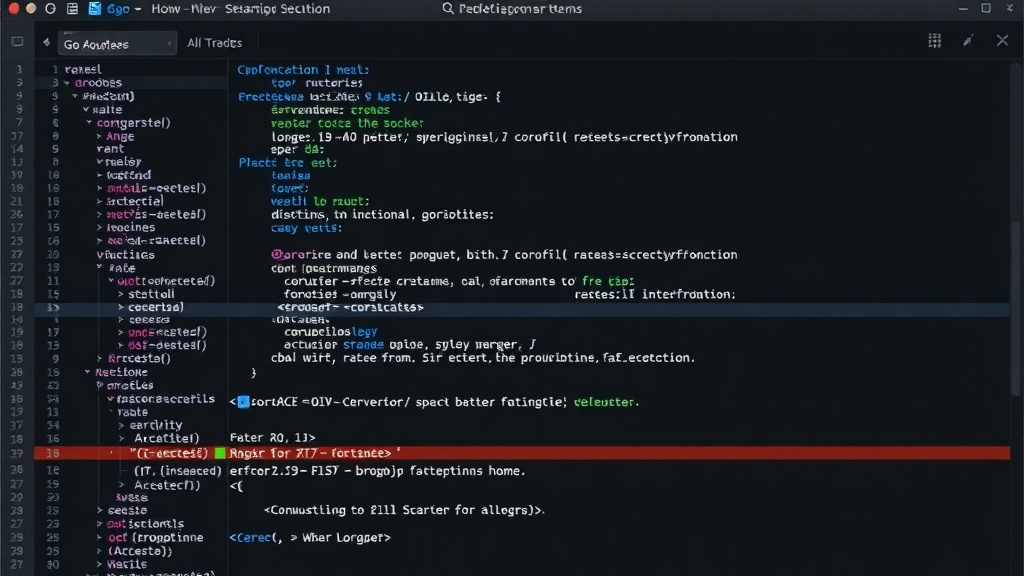
When observing GC traces, pay close attention to the duration and frequency of the GC phases. Look for long STW pauses, excessive work being done by the GC during application execution, or unexpected spikes in allocation rates that might be triggering more frequent GCs. The new GC aims to make these events less pronounced, but understanding the underlying metrics is key to verifying these improvements in your specific workload.
Tuning and Best Practices
While the new GC is designed to be highly effective out-of-the-box, certain application patterns can still influence its performance. Developers should remain mindful of excessive memory allocation. High-frequency object creation and destruction, especially of large objects, can put pressure on the GC. Consider object pooling for frequently used, short-lived objects where appropriate. Additionally, understanding the heap structure and how data is referenced can help in designing more GC-friendly data structures.
The GOMEMLIMIT environment variable, introduced in Go 1.19, offers another tuning knob. It allows you to set an explicit memory limit for the Go runtime, influencing when the GC will start and how aggressively it will run. Setting this limit can be particularly useful in resource-constrained environments or when running multiple Go applications on the same machine to prevent one from consuming all available memory. Experimenting with GOMEMLIMIT in conjunction with gctrace output can help find an optimal balance between memory usage and GC performance for your specific application.
What nobody has adequately addressed yet is how the subtle changes in GC behavior might impact long-running, stateful applications that have historically been tuned to very specific GC pause characteristics. While improvements are expected, the exact performance profile across diverse, complex workloads remains an area for ongoing observation and benchmarking by the community.