Bridging the Observability Gap: From Slow Spans to CPU Hotspots
Application performance troubleshooting often involves two distinct but related datasets: distributed traces and CPU profiles. Traces pinpoint slow requests or operations, showing the flow of execution across services. CPU profiles, on the other hand, reveal where CPU time is being consumed within a single process, identifying hot functions. The challenge has always been to connect these two views seamlessly. A slow span in a trace might be caused by a CPU-intensive function, but without a direct link, developers must manually correlate timestamps and context, a process prone to error and inefficiency.
This article details a novel approach to bridge this gap by integrating Go's built-in `pprof` profiling data with OpenTelemetry (OTel) traces. The core innovation is the conversion of `pprof` data into the OpenTelemetry Protocol (OTLP) Profiles format. This allows granular CPU profile samples to be associated directly with specific trace IDs and span IDs. The result is a powerful end-to-end observability workflow where a developer investigating a slow API endpoint can immediately jump to the precise CPU profile data captured during that specific request's execution.
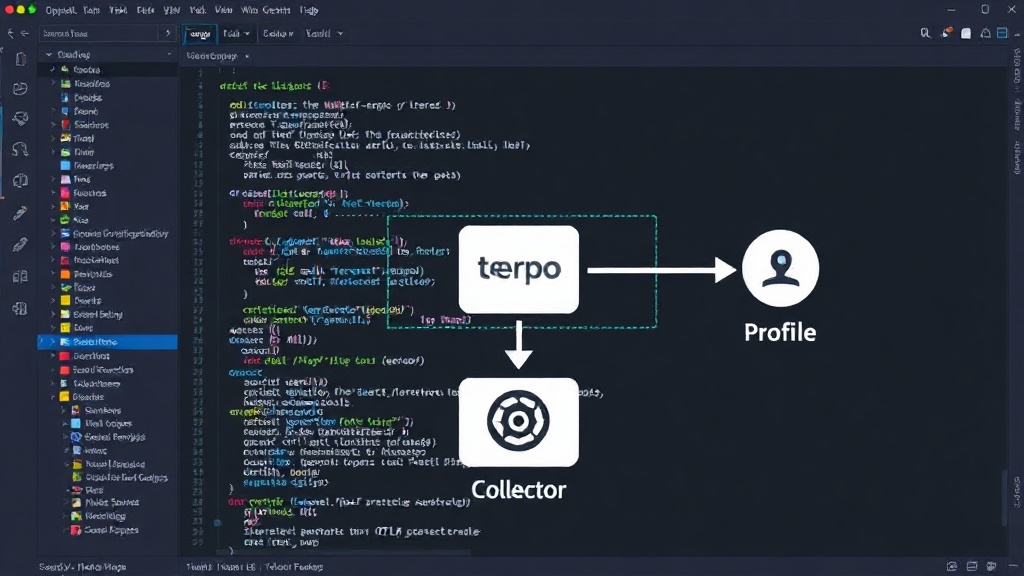
The workflow begins with a Go application instrumented for both tracing and profiling. As requests are processed, OpenTelemetry generates trace data. Simultaneously, `pprof` collects CPU usage profiles. These `pprof` profiles are then transformed into OTLP Profiles. Both the OTLP traces and OTLP Profiles are sent to an OTel Collector. The collector routes traces to a tracing backend like Grafana Tempo and profiles to a profiling backend such as Pyroscope. The crucial link is established when the OTLP Profiles are enriched with trace and span context during ingestion or processing.
The Technical Implementation: OTLP Profiles and Trace Linking
The key to this integration lies in the OTLP Profiles specification. Unlike traditional profiling data, OTLP Profiles are designed to be sent over the wire and can carry rich metadata. By converting Go's `pprof` output (typically in protobuf format) into OTLP Profiles, we enable these profiles to be ingested by standard OTel collectors and subsequently stored in compatible backends. The `go-pprof-otlp-profile-link` repository provides the necessary tooling to achieve this conversion.
The process involves capturing `pprof` data, often using the `net/http/pprof` handlers or direct calls to the `pprof` package. This raw profile data is then parsed. The critical step is mapping the collected samples to their corresponding trace and span IDs. This context is available within the Go application during request handling if the application is already instrumented with OpenTelemetry. Each profile sample, representing a point in time where CPU was consumed, can be tagged with the active trace and span IDs. This tagging allows for precise association.
When the OTLP Profile data arrives at the backend (e.g., Pyroscope), it can be indexed not just by function name and line number, but also by trace ID and span ID. This indexing is what enables the jump-to-profile functionality. Imagine a developer viewing a trace in Grafana, identifying a `GET /cpu-heavy` span that took 5 seconds longer than expected. With this integrated system, clicking on that span would not just show trace details, but also offer a direct link to a flame graph filtered to show only the CPU activity that occurred *during that specific 5-second span*.
Grafana Workflow: From Span to Flame Graph
The ultimate user experience is realized within a system like Grafana, which can query and visualize data from multiple sources. In this setup, Grafana Tempo serves as the tracing backend and Pyroscope as the profiling backend. When a user investigates a slow trace in Grafana, they can see the individual spans. If a particular span is flagged as potentially CPU-bound, a contextual link or button can be presented. Clicking this link triggers a query to Pyroscope, pre-filtered by the trace ID and span ID associated with that slow span.
The result is a Pyroscope flame graph displayed within Grafana, or a link opening Pyroscope directly, showing only the relevant profiling data. For instance, if the slow span was identified as `main.countPrimes` during a `GET /cpu-heavy` request, the flame graph would highlight the `main.countPrimes` function and its call stack, showing exactly how much CPU time it consumed during that specific request. This eliminates the guesswork and manual correlation, dramatically accelerating the debugging process. It's like having a magnifying glass that you can place directly over the exact moment a performance problem occurred, rather than just knowing there was a problem sometime in the last hour.
This integration moves beyond simply having traces and profiles available; it creates a cohesive narrative for performance issues. Developers no longer need to infer causality between a slow trace and CPU usage. The system explicitly shows it. This is particularly valuable in microservices architectures where a single slow request might traverse multiple services, and identifying the bottleneck requires correlating distributed behavior with in-process resource consumption.
Broader Implications and Future Directions
The ability to link `pprof` samples to OTel traces via OTLP Profiles has significant implications for the observability landscape. It standardizes how profiling data can be ingested and queried alongside tracing data, leveraging existing OTel collector infrastructure and popular backends like Tempo and Pyroscope. This approach is not limited to Go; theoretically, any language with profiling capabilities that can be converted to OTLP Profiles could benefit.
The immediate benefit is faster Mean Time To Resolution (MTTR) for performance-related incidents. Instead of sifting through hours of profiling data or trying to match timestamps, engineers can go directly from a symptom (a slow span) to its root cause (a CPU-intensive function call during that span). This reduces cognitive load and speeds up the feedback loop for developers optimizing their code.
The surprising detail here is not the complexity of the conversion, but how well the OTLP Profiles standard accommodates this type of rich, contextualized profiling data. It suggests a future where profiling is as integrated and queryable as tracing or logging, rather than a separate, often manually correlated, diagnostic tool. The complete lab, available in the `go-pprof-otlp-profile-link` repository, provides a practical starting point for anyone looking to implement this powerful observability pattern in their Go applications.